Meta Platforms  META has long seemed to defy expectations, but the social-media giant has seen its stock stall over the past six weeks or so. What does its chart say?
Meta's Technical Analysis
META has gained some 30% year to date and more than 40% over the past 12 months, but has gone pretty much nowhere since July. The stock was trading Wednesday morning at $770.77, down 0.3% from its July 31 $773.44 finish.
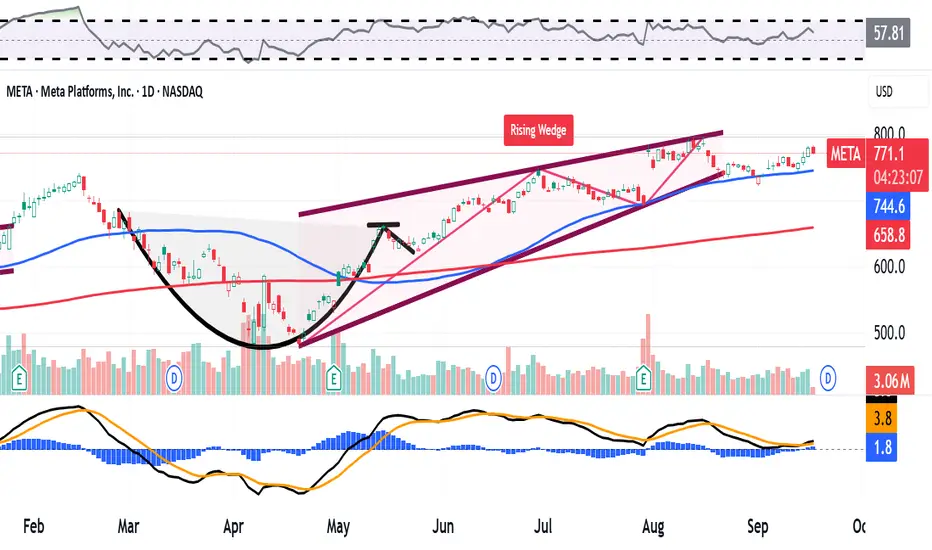
Let's look at META's six-month chart as of Thursday afternoon:

Readers will see that the stock came out of a bullish "cup-with-handle" pattern in May, as denoted with the black curving line at left in the above chart.
The stock blasted past the pattern's $661 pivot (marked with a short black horizontal line) to hit a $796.25 all-time intraday high on Aug. 15.
Based on that pivot and pattern, a trader such as myself would have had a target price in the mid-$790s. So, that technical pattern worked like a charm.
However, META has traded lower to sideways ever since hitting that apex.
In fact, the stock has developed what's called a "rising-wedge" pattern of bearish reversal that goes all the way back to the very bottom of its cup with handle.
META broke the rising wedge's lower trendline in recent days, but did find support at its 50-day Simple Moving Average (or "SMA," marked with a blue line above). A loss of that line would likely result in some loss of institutional support.
Why would technicals that worked so well for this stock suddenly look so lost? Maybe it becomes very difficult to sell tech stocks or even short them ahead of this week's expected dovish monetary-policy pivot by the Federal Reserve.
An Options Strategy Based on META's Volatility
Under these conditions, options traders might consider a strategy based on Meta's potential volatility instead of taking a directional stake in the stock.
After all, there are some potentially important catalysts for META on the way.
First, markets widely expect the Fed to cut the Fed Funds rate's target rate on Wednesday afternoon.
The Fed has scheduled its next policy decision after that for Oct. 29 -- roughly the same time that Wall Street expects Meta to release Q3 results. (META has yet to announce an official earnings-release date.)
An example of a volatility strategy would be a so-called "strangle." This would involve:
-- Selling a $690 Oct. 31 put.
-- Selling an $810 Oct. 31 call.
As I write this, that trade would net a rough $31 in premiums.
Of course, there's certainly risk in this move.
For instance, the trader would be obligated to purchase META shares at $690 or sell them at $810 if the stock moves beyond either of those bands.
That said, the trade doesn't lose money on a net basis in this set-up unless the stock trades above $846 or below $659 at expiration.
This chart illustrates the price levels for the equity where profit created by the options set up starts to degrade:

A more-cautious trader might purchase an even-wider strangle in order to manage the risk. However, that would eat into the net credit received from the premiums collected.
(Moomoo Technologies Inc. Markets Commentator Stephen “Sarge” Guilfoyle had no position in META at the time of writing this column.)
This article discusses technical analysis, other approaches, including fundamental analysis, may offer very different views. The examples provided are for illustrative purposes only and are not intended to be reflective of the results you can expect to achieve. Specific security charts used are for illustrative purposes only and are not a recommendation, offer to sell, or a solicitation of an offer to buy any security. Past investment performance does not indicate or guarantee future success. Returns will vary, and all investments carry risks, including loss of principal. This content is also not a research report and is not intended to serve as the basis for any investment decision. The information contained in this article does not purport to be a complete description of the securities, markets, or developments referred to in this material. Moomoo and its affiliates make no representation or warranty as to the article's adequacy, completeness, accuracy or timeliness for any particular purpose of the above content. Furthermore, there is no guarantee that any statements, estimates, price targets, opinions or forecasts provided herein will prove to be correct.
Options trading is risky and not appropriate for everyone. Read the Options Disclosure Document (https://j.moomoo.com/017y9J) before trading. Options are complex and you may quickly lose the entire investment. Supporting docs for any claims will be furnished upon request.
Options trading subject to eligibility requirements. Strategies available will depend on options level approved.
Moomoo is a financial information and trading app offered by Moomoo Technologies Inc. In the U.S., investment products and services on Moomoo are offered by Moomoo Financial Inc., Member FINRA/SIPC.
TradingView is an independent third party not affiliated with Moomoo Financial Inc., Moomoo Technologies Inc., or its affiliates. Moomoo Financial Inc. and its affiliates do not endorse, represent or warrant the completeness and accuracy of the data and information available on the TradingView platform and are not responsible for any services provided by the third-party platform.
Meta's Technical Analysis
META has gained some 30% year to date and more than 40% over the past 12 months, but has gone pretty much nowhere since July. The stock was trading Wednesday morning at $770.77, down 0.3% from its July 31 $773.44 finish.
Let's look at META's six-month chart as of Thursday afternoon:
Readers will see that the stock came out of a bullish "cup-with-handle" pattern in May, as denoted with the black curving line at left in the above chart.
The stock blasted past the pattern's $661 pivot (marked with a short black horizontal line) to hit a $796.25 all-time intraday high on Aug. 15.
Based on that pivot and pattern, a trader such as myself would have had a target price in the mid-$790s. So, that technical pattern worked like a charm.
However, META has traded lower to sideways ever since hitting that apex.
In fact, the stock has developed what's called a "rising-wedge" pattern of bearish reversal that goes all the way back to the very bottom of its cup with handle.
META broke the rising wedge's lower trendline in recent days, but did find support at its 50-day Simple Moving Average (or "SMA," marked with a blue line above). A loss of that line would likely result in some loss of institutional support.
Why would technicals that worked so well for this stock suddenly look so lost? Maybe it becomes very difficult to sell tech stocks or even short them ahead of this week's expected dovish monetary-policy pivot by the Federal Reserve.
An Options Strategy Based on META's Volatility
Under these conditions, options traders might consider a strategy based on Meta's potential volatility instead of taking a directional stake in the stock.
After all, there are some potentially important catalysts for META on the way.
First, markets widely expect the Fed to cut the Fed Funds rate's target rate on Wednesday afternoon.
The Fed has scheduled its next policy decision after that for Oct. 29 -- roughly the same time that Wall Street expects Meta to release Q3 results. (META has yet to announce an official earnings-release date.)
An example of a volatility strategy would be a so-called "strangle." This would involve:
-- Selling a $690 Oct. 31 put.
-- Selling an $810 Oct. 31 call.
As I write this, that trade would net a rough $31 in premiums.
Of course, there's certainly risk in this move.
For instance, the trader would be obligated to purchase META shares at $690 or sell them at $810 if the stock moves beyond either of those bands.
That said, the trade doesn't lose money on a net basis in this set-up unless the stock trades above $846 or below $659 at expiration.
This chart illustrates the price levels for the equity where profit created by the options set up starts to degrade:
A more-cautious trader might purchase an even-wider strangle in order to manage the risk. However, that would eat into the net credit received from the premiums collected.
(Moomoo Technologies Inc. Markets Commentator Stephen “Sarge” Guilfoyle had no position in META at the time of writing this column.)
This article discusses technical analysis, other approaches, including fundamental analysis, may offer very different views. The examples provided are for illustrative purposes only and are not intended to be reflective of the results you can expect to achieve. Specific security charts used are for illustrative purposes only and are not a recommendation, offer to sell, or a solicitation of an offer to buy any security. Past investment performance does not indicate or guarantee future success. Returns will vary, and all investments carry risks, including loss of principal. This content is also not a research report and is not intended to serve as the basis for any investment decision. The information contained in this article does not purport to be a complete description of the securities, markets, or developments referred to in this material. Moomoo and its affiliates make no representation or warranty as to the article's adequacy, completeness, accuracy or timeliness for any particular purpose of the above content. Furthermore, there is no guarantee that any statements, estimates, price targets, opinions or forecasts provided herein will prove to be correct.
Options trading is risky and not appropriate for everyone. Read the Options Disclosure Document (https://j.moomoo.com/017y9J) before trading. Options are complex and you may quickly lose the entire investment. Supporting docs for any claims will be furnished upon request.
Options trading subject to eligibility requirements. Strategies available will depend on options level approved.
Moomoo is a financial information and trading app offered by Moomoo Technologies Inc. In the U.S., investment products and services on Moomoo are offered by Moomoo Financial Inc., Member FINRA/SIPC.
TradingView is an independent third party not affiliated with Moomoo Financial Inc., Moomoo Technologies Inc., or its affiliates. Moomoo Financial Inc. and its affiliates do not endorse, represent or warrant the completeness and accuracy of the data and information available on the TradingView platform and are not responsible for any services provided by the third-party platform.
Disclaimer
The information and publications are not meant to be, and do not constitute, financial, investment, trading, or other types of advice or recommendations supplied or endorsed by TradingView. Read more in the Terms of Use.
Disclaimer
The information and publications are not meant to be, and do not constitute, financial, investment, trading, or other types of advice or recommendations supplied or endorsed by TradingView. Read more in the Terms of Use.