Three Step Challenge.
Day Trading Nasdaq-100 Futures.
I "Bachelor's"
II "Master's"
III "Phd"
I "Bachelor's"
A. Workshop: five tabs plus a reliable business news service
*1. marketwatch.com/economy-politics/calendar?mod=economy-politics
*2. 4 Hour chart
***a. Session Volume Profile
***b. volume bars
*3. Daily chart
***a. volume bars
***b. 50-d simple moving average
***c. 200-d simple moving average
*4. 1 Hour chart
***a. Visible Range Volume Profile
***b. volume bars
*5. 5-minute chart
***a. volume bars
*6. Business news Fox, MSNBC, Bloomberg etc
Yesterday's chart was all about an outstanding, high probability win rate Buy the Dip plan. Now we shall earn a B.D. in BTD trades for the Nasdaq-100 futures. This will be applicable to the Dow, S&P 500 and the Russ 2000 futures. We shall go on to earn a Master's and then a Ph.D.. At the end you will be one of the best Buy the Dip traders on the planet.
The old ladies taught this trader how to outline in the fourth grade. He doesn't represent this as their best teaching but as his best (poor) remembrance.
He will stumble and bumble, but we'll get to the end. Let's call step 1 a Bachelor of Buying the Dip Degree - B.BTD.
Above is a rough outline of his workshop. If you like it use it. You are a unique individual. Do what works for you.
Expect additions, subtractions, revisions, anecdotes and, hopefully, facts.
Note
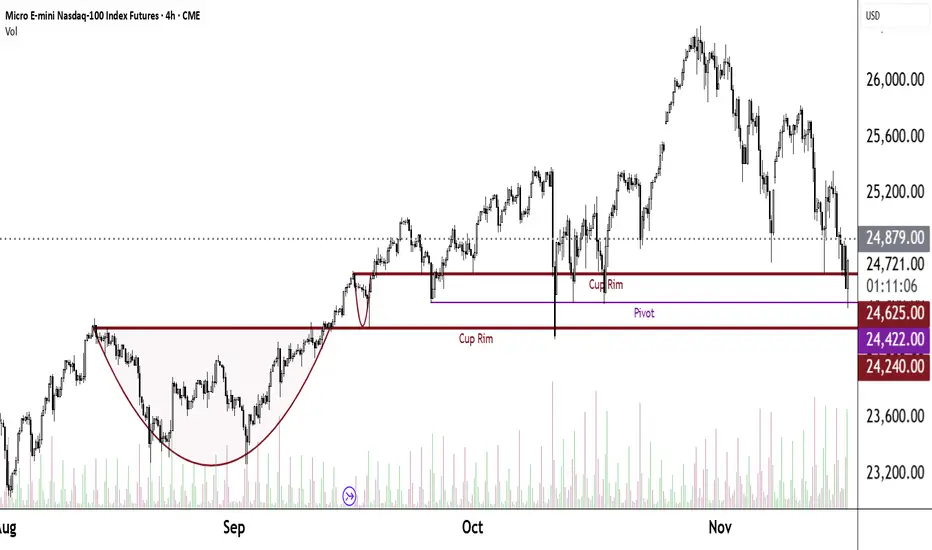
On today's 5m chart you would have seen the 10:05 Bull Engulfing candle with volume at support. Sometimes it is helpful to go to a smaller time frame to find the first entry. He went to a 30sec chart and used 24500 as his first entry. As always, he bot 1 MNQ in descending 5-point increments to 24435, each and every entry had a 21-point target. Remember, anecdotally, the middle third of that area has the highest win rate.
The next important event was the combination of the 11:00 Exhaustion Candle followed immediately by a White Bull bouncing on a strong support. In such an event his priority is Breakout trades. He got in just above the White Bull - +4 @ 24520, 19-point target. Every 20 points +4 target 19 points. The last +4 entry was 25660 - just above the 24625 resistance.
The px pulled back and formed a 12:30 white hammer. Starting @ 25550 he bot 4 every 20 points up to 24670, same 19-point target. From 24700 he will buy 3 every 20 points up to 24860. Thereafter it will likely be +1 every 20 points.
Note
The underlying principle - always take advantage of a strong bounce on a strong support after a pullback. Note
Why slow down @24860? Yesterday's close was 24879. It will most likely slow the momentum.Note
Private thoughts on outline.Mrs. Webb said three points and a poem. A is workshop. B ?interpretation. C ?trade plans. Poem ?Fifteen men on a dead man's chest.
A work in progress.
Note
I Bachelor's or B.BTDA. Workshop: five tabs and a business news source
B. Chart interpretation
How can B be anything but chart interpretation? Much has already been said on the subject in prior posts. Here's a Caution Formation. From the 13:00 5m candle to the 13:55 close a Reverse Ascending Triangle formed. When he sees this, he thinks Caution. Couple that with the congestion at that px point to the left of the chart and to the size and volume of the 13:55 candle he sold all his longs but one.
Disclaimer
The information and publications are not meant to be, and do not constitute, financial, investment, trading, or other types of advice or recommendations supplied or endorsed by TradingView. Read more in the Terms of Use.
Disclaimer
The information and publications are not meant to be, and do not constitute, financial, investment, trading, or other types of advice or recommendations supplied or endorsed by TradingView. Read more in the Terms of Use.