MRVL Bear Flag Pattern
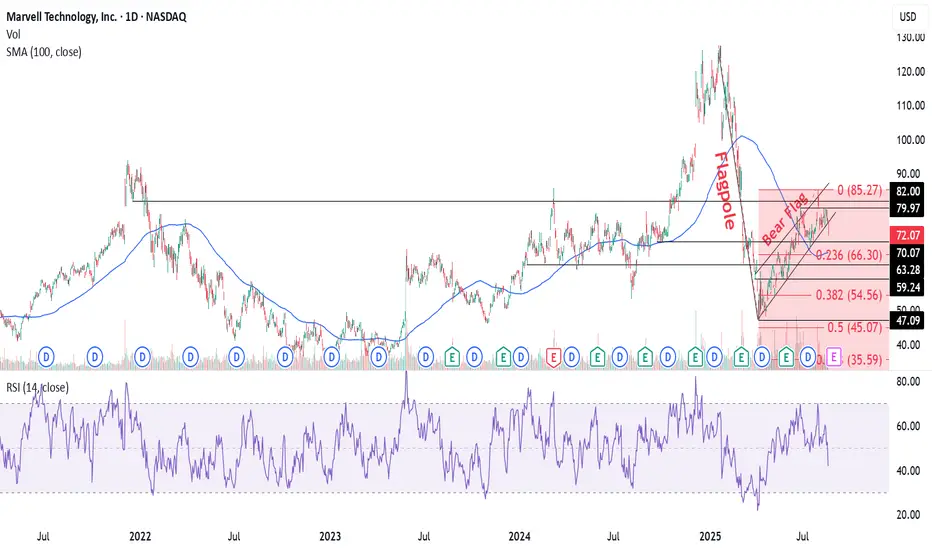
The MRVL chart indicates a bear flag formation, suggesting a continuation of the downtrend from its all-time high of $127.48 in January 2025. After hitting a low of $47.09 in April 2025, the stock consolidated between $47-$85. The recent breach below the sideways channel reflects the bear flag's flagpole, echoing the preceding downward trend.
Technical Indicators
The stock trades below its 50 DMA ($74.28) and 200 DMA ($83.13), reinforcing bearish sentiment. The daily RSI at 42 further underscores weakening momentum.
Trading Strategy
• Entry:$72-$70
• 1st Target: 100 DMA at $66.84, aligning with the 0.236 Fibonacci extension level at $66.30
• Next Targets: $63.28, $59.24, and $54.56
• Stop Loss: $80
Potential Downside
Should bearishness persist, the stock may revisit its 52-week low of $47.09, marking a significant support level.
Trade active
MRVL stock dropped sharply (-18.6%) on Friday's trading session as its Q3 revenue forecast of about $2.06B came in below analyst expectations of roughly $2.11B. This overshadowed strong Q2 results—revenue up 58% YoY to $2.01B and adjusted EPS of $0.67—and fueled investor disappointment, with sentiment dampened by the weaker outlook despite high hopes tied to its AI chip business.The stock has hit its initial downside targets of $66.84 and $63.28, eventually closing at $62.87. The bearish flag pattern has unfolded as expected, and it will be interesting to see how it develops further.
Disclaimer
The information and publications are not meant to be, and do not constitute, financial, investment, trading, or other types of advice or recommendations supplied or endorsed by TradingView. Read more in the Terms of Use.
Disclaimer
The information and publications are not meant to be, and do not constitute, financial, investment, trading, or other types of advice or recommendations supplied or endorsed by TradingView. Read more in the Terms of Use.