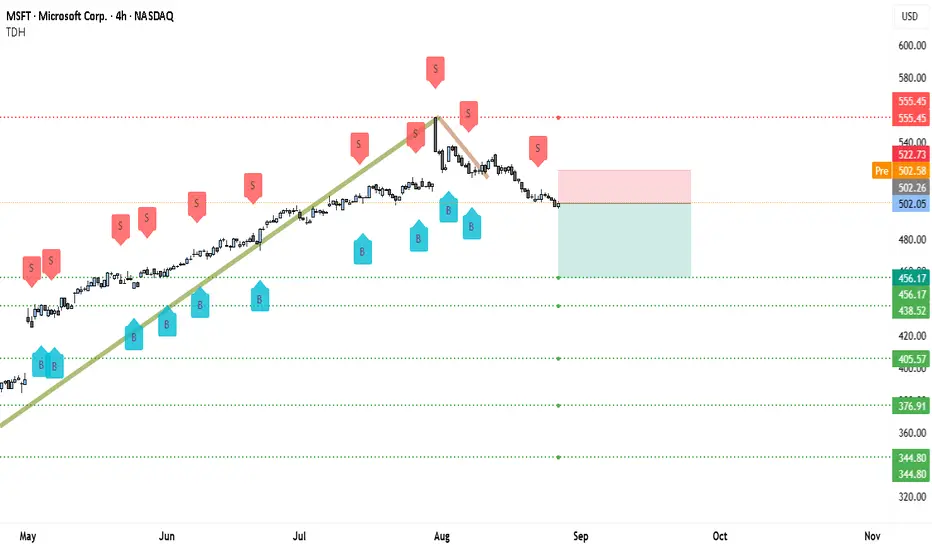
On the 4H chart of Microsoft (MSFT), the overall structure has shifted from bullish to bearish. For several months, MSFT respected a strong upward trendline, consistently forming higher highs and higher lows. This uptrend peaked around the $555 zone, after which sellers started dominating. The sharp rejection near $555, followed by lower highs, marks the beginning of a trend reversal.
Currently, the stock trades around the $502 mark, consolidating just below a minor resistance band of $502–$505. This is a critical zone because if the price fails to reclaim this level, sellers will likely push it lower. The chart clearly shows broken momentum from the uptrend, and the downside is now open toward the next demand levels.
Support levels are clearly defined: the first significant support is near $456. If broken, the next key zones are at $405 and $376, while $344 would be the deeper downside extension. These levels are aligned with prior accumulation areas where buyers previously stepped in.
The bearish case strengthens further given that the stock has failed to bounce convincingly after each sell-off in August, suggesting weak buying interest. The momentum indicators (as seen from price swings) are also tilting toward sellers.
🔽 Bearish Trade Setup (H4 MSFT)
• Entry Zone: $500–$505 (current rejection area)
• Stop Loss: Above $522 (last breakdown level)
• Target 1: $456.17
• Target 2: $405.57
• Target 3 (extended): $376.91
Managing the trade is just as important as the entry. Once the first target at $456 is achieved, partial profit booking is advisable. Closing 30–40% of the position there reduces exposure while still keeping you in the trend. At this stage, the stop-loss should be adjusted to breakeven ($500), eliminating risk on the remaining position. As price approaches deeper levels like $405 and $376, trailing stops should be moved down above each recent swing high on the 4H chart. This trailing stop technique ensures that profits are locked in while still allowing room for the trend to continue.
If MSFT shows strong momentum and breaks below $405 with conviction, the path toward $376 and potentially $344 becomes very realistic. In such extended moves, aggressive trailing stops help capture as much of the move as possible without exposing capital unnecessarily.
In summary, MSFT has transitioned into a bearish phase on the H4 timeframe. A short position around the $500–$505 rejection zone provides a strong risk-to-reward trade setup. With partial profit booking at support levels and disciplined trailing stops, the bearish move can be capitalized on while protecting gains throughout the trend.
Trade forex, indices, stocks and metals with up to US$100.000 in company's funding.
Complete a challenge to access funding or go for instant deposit.
Trading involves substantial risk. Not financial advice
Complete a challenge to access funding or go for instant deposit.
Trading involves substantial risk. Not financial advice
Related publications
Disclaimer
The information and publications are not meant to be, and do not constitute, financial, investment, trading, or other types of advice or recommendations supplied or endorsed by TradingView. Read more in the Terms of Use.