# The Escalation Pattern: MSFT's Strengthening Rejection
## Seller Authority Confirmed (Points 1→3)
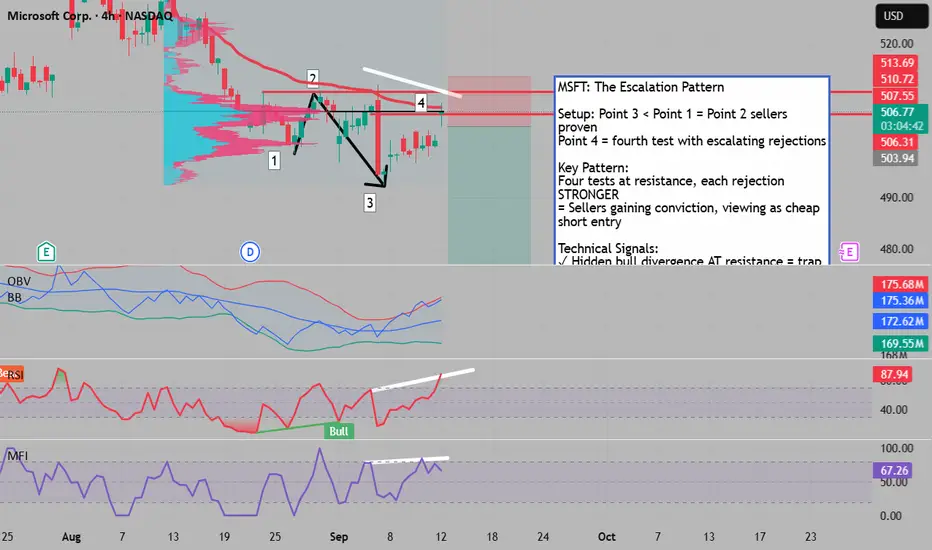
The market delivered its verdict when Point 3 closed decisively below Point 1, establishing Point 2 sellers as the dominant force in the local market structure. This wasn't a minor victory - it was proof of seller superiority. Now at Point 4, price has returned to test these proven sellers' resolve.
## The Escalation Phenomenon
What makes this setup extraordinary is the escalating rejection pattern. Price has tested this resistance zone three times, and each rejection has been progressively stronger. This isn't random - it reveals sellers gaining conviction, increasingly viewing these levels as attractive short entries.
Think of it as the opposite of accumulation - it's distribution with growing confidence. Each failed attempt emboldens more sellers to defend this zone.
## Hidden Bullish Divergence - The Trap
Here's where it gets interesting:
• Price: Lower high at Point 4
• RSI/MFI: Higher highs (hidden bullish divergence)
• Both oscillators: Oversold territory
Typically, hidden bullish divergence suggests continuation up. But when it appears at proven resistance with escalating rejections, it becomes a trap. The divergence shows buyers trying harder (higher momentum) but achieving less (lower price high) - a sign of exhaustion, not strength.
## The Volume Ceiling Signal
The OBV has pierced the upper Bollinger Band - a rare occurrence that typically precedes reversals. When volume indicators hit extremes while price fails to break resistance, it suggests:
• Buyers exhausting their ammunition
• Sellers absorbing all buying pressure
• Imminent reversal as buying dries up
## VWAP and POC Alignment
Using a local high anchor, price touches the VWAP median line - a mathematical resistance point. More importantly, at trade entry (stop order), we'll be below the Point of Control (POC), meaning:
• Highest volume node acts as support for shorts
• Majority of traders have positions above current price
• Institutional algorithms defend POC levels
## The Triple Test Rule
In technical analysis, the triple test is significant:
• First test: Establishes resistance
• Second test: Confirms resistance
• Third test: Often breaks OR fails spectacularly
With each test showing stronger rejection, we're seeing the "fail spectacularly" scenario setting up.
## Risk Management Framework
Entry Signal:
• Current rejection from Point 4
• Stop order activation below POC
Stop Loss: 513.69 (1.93% risk) - Above Point 2 (proven seller level)
Target: 496.69 (11.25% reward) - Chaos Theory zone support
Risk/Reward Ratio: 1:5.8
Position Advantages:
• POC below entry provides support
• Multiple rejections reduce false breakout risk
• Escalating pattern suggests strong conviction
• Target aligns with mathematical support zone from Chaos Theory indicator
## The Conviction Story
The escalating rejections tell a clear narrative:
1. Sellers defend their territory (first test)
2. Sellers gain confidence (second test, stronger rejection)
3. Sellers become aggressive (third test, even stronger rejection)
4. Sellers dominate completely (fourth test, strongest rejection yet)
5. Buyers exhaust despite trying harder (divergence trap)
This isn't just resistance - it's active, confident distribution.
---
Key Takeaway: When resistance strengthens with each test rather than weakens, when divergences appear at proven resistance, and when volume hits extremes without price progress, you're witnessing distribution, not accumulation. The escalation pattern suggests this isn't just a top - it's a top with conviction.
## Seller Authority Confirmed (Points 1→3)
The market delivered its verdict when Point 3 closed decisively below Point 1, establishing Point 2 sellers as the dominant force in the local market structure. This wasn't a minor victory - it was proof of seller superiority. Now at Point 4, price has returned to test these proven sellers' resolve.
## The Escalation Phenomenon
What makes this setup extraordinary is the escalating rejection pattern. Price has tested this resistance zone three times, and each rejection has been progressively stronger. This isn't random - it reveals sellers gaining conviction, increasingly viewing these levels as attractive short entries.
Think of it as the opposite of accumulation - it's distribution with growing confidence. Each failed attempt emboldens more sellers to defend this zone.
## Hidden Bullish Divergence - The Trap
Here's where it gets interesting:
• Price: Lower high at Point 4
• RSI/MFI: Higher highs (hidden bullish divergence)
• Both oscillators: Oversold territory
Typically, hidden bullish divergence suggests continuation up. But when it appears at proven resistance with escalating rejections, it becomes a trap. The divergence shows buyers trying harder (higher momentum) but achieving less (lower price high) - a sign of exhaustion, not strength.
## The Volume Ceiling Signal
The OBV has pierced the upper Bollinger Band - a rare occurrence that typically precedes reversals. When volume indicators hit extremes while price fails to break resistance, it suggests:
• Buyers exhausting their ammunition
• Sellers absorbing all buying pressure
• Imminent reversal as buying dries up
## VWAP and POC Alignment
Using a local high anchor, price touches the VWAP median line - a mathematical resistance point. More importantly, at trade entry (stop order), we'll be below the Point of Control (POC), meaning:
• Highest volume node acts as support for shorts
• Majority of traders have positions above current price
• Institutional algorithms defend POC levels
## The Triple Test Rule
In technical analysis, the triple test is significant:
• First test: Establishes resistance
• Second test: Confirms resistance
• Third test: Often breaks OR fails spectacularly
With each test showing stronger rejection, we're seeing the "fail spectacularly" scenario setting up.
## Risk Management Framework
Entry Signal:
• Current rejection from Point 4
• Stop order activation below POC
Stop Loss: 513.69 (1.93% risk) - Above Point 2 (proven seller level)
Target: 496.69 (11.25% reward) - Chaos Theory zone support
Risk/Reward Ratio: 1:5.8
Position Advantages:
• POC below entry provides support
• Multiple rejections reduce false breakout risk
• Escalating pattern suggests strong conviction
• Target aligns with mathematical support zone from Chaos Theory indicator
## The Conviction Story
The escalating rejections tell a clear narrative:
1. Sellers defend their territory (first test)
2. Sellers gain confidence (second test, stronger rejection)
3. Sellers become aggressive (third test, even stronger rejection)
4. Sellers dominate completely (fourth test, strongest rejection yet)
5. Buyers exhaust despite trying harder (divergence trap)
This isn't just resistance - it's active, confident distribution.
---
Key Takeaway: When resistance strengthens with each test rather than weakens, when divergences appear at proven resistance, and when volume hits extremes without price progress, you're witnessing distribution, not accumulation. The escalation pattern suggests this isn't just a top - it's a top with conviction.
for trading mentorship and community, message me on telegram : jacesabr_real
Disclaimer
The information and publications are not meant to be, and do not constitute, financial, investment, trading, or other types of advice or recommendations supplied or endorsed by TradingView. Read more in the Terms of Use.