Overview:
Microsoft is showing a monthly Rate of Change (ROC) above 0%, while the weekly ROC is below 0%, suggesting a potential reversal zone. This setup combines trend indicators with candlestick confirmation for a high-probability entry, part of what we call the Rocket Booster Strategy.
Rocket Booster Strategy Criteria:
Candlestick Confirmation:
Daily Candle: Long lower shadow – shows buying pressure.
Hammer Pattern: Confirmed on both daily and 4-hour charts, indicating potential reversal and continuation of bullish momentum.
Entry Strategy:
Wait for the 4H chart close above the hammer confirmation level for a safer entry.
This setup leverages both momentum and trend alignment, increasing the chance of a profitable trade.
Risk Management:
Place stop-loss below the low of the daily hammer candle.
Use position sizing according to your risk tolerance.
Always practice on a demo/simulation account before trading with real money.
Key Takeaways:
Conclusion:
This MSFT setup combines trend, momentum, and candlestick analysis into the Rocket Booster Strategy. Traders should wait for proper confirmation, manage risk carefully, and consider using a simulation account first.
Rocket boost this content to learn more
Disclaimer:
This article is for educational purposes only and does not constitute financial advice. Trading stocks involves risk.
Always practice on a simulation/demo account before trading with real money, and consult a licensed financial advisor. Past performance is not indicative of future results.
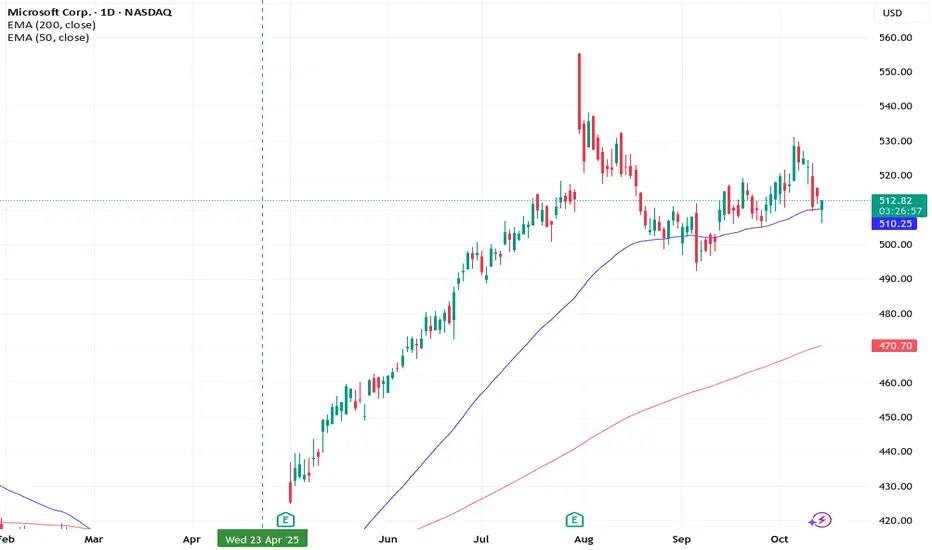
Microsoft is showing a monthly Rate of Change (ROC) above 0%, while the weekly ROC is below 0%, suggesting a potential reversal zone. This setup combines trend indicators with candlestick confirmation for a high-probability entry, part of what we call the Rocket Booster Strategy.
Rocket Booster Strategy Criteria:
- Price is above the 50 EMA – signals short-term bullish momentum.
- Price is above the 200 EMA – confirms long-term bullish trend.
- Price has gapped up – adds momentum and increases the probability of a strong move.
Candlestick Confirmation:
Daily Candle: Long lower shadow – shows buying pressure.
Hammer Pattern: Confirmed on both daily and 4-hour charts, indicating potential reversal and continuation of bullish momentum.
Entry Strategy:
Wait for the 4H chart close above the hammer confirmation level for a safer entry.
This setup leverages both momentum and trend alignment, increasing the chance of a profitable trade.
Risk Management:
Place stop-loss below the low of the daily hammer candle.
Use position sizing according to your risk tolerance.
Always practice on a demo/simulation account before trading with real money.
Key Takeaways:
- Monthly ROC above 0% → medium-term bullish bias.
- Weekly ROC below 0% → short-term weakness, ideal for reversal.
- Alignment above 50 EMA and 200 EMA + gap-up → Rocket Booster momentum.
- Candlestick confirmation (hammer + long lower shadow) strengthens entry signal.
Conclusion:
This MSFT setup combines trend, momentum, and candlestick analysis into the Rocket Booster Strategy. Traders should wait for proper confirmation, manage risk carefully, and consider using a simulation account first.
Rocket boost this content to learn more
Disclaimer:
This article is for educational purposes only and does not constitute financial advice. Trading stocks involves risk.
Always practice on a simulation/demo account before trading with real money, and consult a licensed financial advisor. Past performance is not indicative of future results.
Related publications
Disclaimer
The information and publications are not meant to be, and do not constitute, financial, investment, trading, or other types of advice or recommendations supplied or endorsed by TradingView. Read more in the Terms of Use.
Related publications
Disclaimer
The information and publications are not meant to be, and do not constitute, financial, investment, trading, or other types of advice or recommendations supplied or endorsed by TradingView. Read more in the Terms of Use.