Micron Technology  MU hit an all-time intraday high this week as multiple analysts raised their price targets for the tech firm amid strong demand from AI-related companies for MU's high-bandwidth memory. What does technical and fundamental analysis say the Micron prepares to report earnings next week?
Let's see:
Micron's Fundamental Analysis
All of the GPUs and high-end chips destined for data centers and generative artificial intelligence need memory -- lots and lots of memory.
This has created shortages (and higher prices) for high-bandwidth, high-speed DRAM chips, and Micron is the only U.S.-based source for those. The company's top competitors for that high-end marketing are both South Korean firms, SK Hynix and Samsung Electronics.
When Micron reports fiscal Q4 earnings after the bell next Tuesday, Wall Street will be looking for the firm to report $2.86 of adjusted earnings per share on $11.1 billion of revenue.
That would crush the firm's own guidance, and also represent a 142.4% gain from the $1.18 in adjusted EPS that MU reported in the year-ago period. Revenue would also have grown some 43% from the $7.75 billion the company rang up in the same period last year.
And of the 21 sell-side analysts that I can find that cover MU, 20 have revised their earnings estimates for the period higher since the current quarter began. (One analyst lowered his forecast.)
This week, Vijay Rakesh of Mizuho Securities (rated at five stars out of a possible five by TipRanks) reiterated his "Buy" rating on MU while increasing his target price to $182 from $155.
A day earlier, CJ Muse of Cantor Fitzgerald and Timothy Acuri of UBS (both also rated at five stars by TipRanks) reiterated their own "Buy" ratings. Both also increased their target prices from an identical $155 to $185.
Micron's Technical Analysis
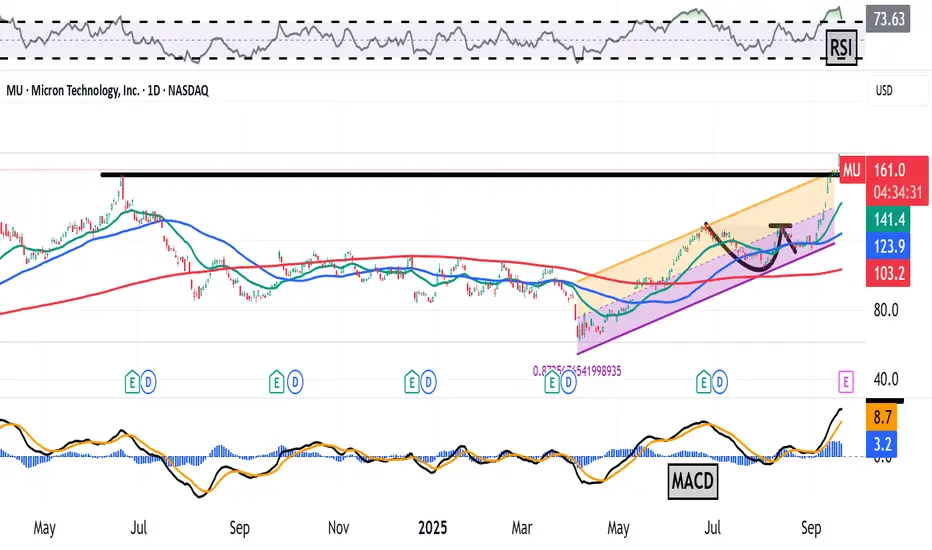
Now let's look at MU's chart going back to April 2024 and running through Tuesday afternoon:

Readers will note that MU recently broke out of a "cup-with-handle" pattern that it had been in from June through mid-August and that had a $128 pivot.
The stock does now appear to be extended from that, which might rattle a few investors (especially as MU heads into earnings).
Meanwhile, MU's Relative Strength Index (the gray line at the chart's top) is in a technically overbought state.
That said, the stock's daily Moving Average Convergence Divergence indicator (or "MACD," marked with black and gold lines and blue bars at the chart's bottom) is looking extremely bullish.
The histogram of the 9-day EMA (the blue bars) is now well above zero, as are both the 12-day Exponential Moving Average (or "EMA," marked with a black line) and the 26-day EMA (the gold line). The 12-day EMA is pulling away from the 26-day line. All of that is very bullish technically.
MU did, in fact, crash through its previous all-time high of June 2024 (marked with a heavy black line) on Thursday.
That level (about $157) was the pivot for the bulls that has now been triggered technically. (That's where all of those elevated target prices from the above-mentioned analysts came from.)
The downside pivot? It's a long way down at Micron's 50-day EMA (marked with a blue line at $121.50 in the chart above).
All in, I would not be surprised if MU remains volatile heading into and coming out of next week's earnings report.
(Moomoo Technologies Inc. Markets Commentator Stephen “Sarge” Guilfoyle was long MU at the time of writing this column.)
This article discusses technical analysis, other approaches, including fundamental analysis, may offer very different views. The examples provided are for illustrative purposes only and are not intended to be reflective of the results you can expect to achieve. Specific security charts used are for illustrative purposes only and are not a recommendation, offer to sell, or a solicitation of an offer to buy any security. Past investment performance does not indicate or guarantee future success. Returns will vary, and all investments carry risks, including loss of principal. This content is also not a research report and is not intended to serve as the basis for any investment decision. The information contained in this article does not purport to be a complete description of the securities, markets, or developments referred to in this material. Moomoo and its affiliates make no representation or warranty as to the article's adequacy, completeness, accuracy or timeliness for any particular purpose of the above content. Furthermore, there is no guarantee that any statements, estimates, price targets, opinions or forecasts provided herein will prove to be correct.
The Analyst Ratings feature comes from TipRanks, an independent third party. The accuracy, completeness, or reliability cannot be guaranteed and should not be relied upon as a primary basis for any investment decision. The target prices are intended for informational purposes only, not recommendations, and are also not guarantees of future results.
Moomoo is a financial information and trading app offered by Moomoo Technologies Inc. In the U.S., investment products and services on Moomoo are offered by Moomoo Financial Inc., Member FINRA/SIPC.
TradingView is an independent third party not affiliated with Moomoo Financial Inc., Moomoo Technologies Inc., or its affiliates. Moomoo Financial Inc. and its affiliates do not endorse, represent or warrant the completeness and accuracy of the data and information available on the TradingView platform and are not responsible for any services provided by the third-party platform.
Let's see:
Micron's Fundamental Analysis
All of the GPUs and high-end chips destined for data centers and generative artificial intelligence need memory -- lots and lots of memory.
This has created shortages (and higher prices) for high-bandwidth, high-speed DRAM chips, and Micron is the only U.S.-based source for those. The company's top competitors for that high-end marketing are both South Korean firms, SK Hynix and Samsung Electronics.
When Micron reports fiscal Q4 earnings after the bell next Tuesday, Wall Street will be looking for the firm to report $2.86 of adjusted earnings per share on $11.1 billion of revenue.
That would crush the firm's own guidance, and also represent a 142.4% gain from the $1.18 in adjusted EPS that MU reported in the year-ago period. Revenue would also have grown some 43% from the $7.75 billion the company rang up in the same period last year.
And of the 21 sell-side analysts that I can find that cover MU, 20 have revised their earnings estimates for the period higher since the current quarter began. (One analyst lowered his forecast.)
This week, Vijay Rakesh of Mizuho Securities (rated at five stars out of a possible five by TipRanks) reiterated his "Buy" rating on MU while increasing his target price to $182 from $155.
A day earlier, CJ Muse of Cantor Fitzgerald and Timothy Acuri of UBS (both also rated at five stars by TipRanks) reiterated their own "Buy" ratings. Both also increased their target prices from an identical $155 to $185.
Micron's Technical Analysis
Now let's look at MU's chart going back to April 2024 and running through Tuesday afternoon:
Readers will note that MU recently broke out of a "cup-with-handle" pattern that it had been in from June through mid-August and that had a $128 pivot.
The stock does now appear to be extended from that, which might rattle a few investors (especially as MU heads into earnings).
Meanwhile, MU's Relative Strength Index (the gray line at the chart's top) is in a technically overbought state.
That said, the stock's daily Moving Average Convergence Divergence indicator (or "MACD," marked with black and gold lines and blue bars at the chart's bottom) is looking extremely bullish.
The histogram of the 9-day EMA (the blue bars) is now well above zero, as are both the 12-day Exponential Moving Average (or "EMA," marked with a black line) and the 26-day EMA (the gold line). The 12-day EMA is pulling away from the 26-day line. All of that is very bullish technically.
MU did, in fact, crash through its previous all-time high of June 2024 (marked with a heavy black line) on Thursday.
That level (about $157) was the pivot for the bulls that has now been triggered technically. (That's where all of those elevated target prices from the above-mentioned analysts came from.)
The downside pivot? It's a long way down at Micron's 50-day EMA (marked with a blue line at $121.50 in the chart above).
All in, I would not be surprised if MU remains volatile heading into and coming out of next week's earnings report.
(Moomoo Technologies Inc. Markets Commentator Stephen “Sarge” Guilfoyle was long MU at the time of writing this column.)
This article discusses technical analysis, other approaches, including fundamental analysis, may offer very different views. The examples provided are for illustrative purposes only and are not intended to be reflective of the results you can expect to achieve. Specific security charts used are for illustrative purposes only and are not a recommendation, offer to sell, or a solicitation of an offer to buy any security. Past investment performance does not indicate or guarantee future success. Returns will vary, and all investments carry risks, including loss of principal. This content is also not a research report and is not intended to serve as the basis for any investment decision. The information contained in this article does not purport to be a complete description of the securities, markets, or developments referred to in this material. Moomoo and its affiliates make no representation or warranty as to the article's adequacy, completeness, accuracy or timeliness for any particular purpose of the above content. Furthermore, there is no guarantee that any statements, estimates, price targets, opinions or forecasts provided herein will prove to be correct.
The Analyst Ratings feature comes from TipRanks, an independent third party. The accuracy, completeness, or reliability cannot be guaranteed and should not be relied upon as a primary basis for any investment decision. The target prices are intended for informational purposes only, not recommendations, and are also not guarantees of future results.
Moomoo is a financial information and trading app offered by Moomoo Technologies Inc. In the U.S., investment products and services on Moomoo are offered by Moomoo Financial Inc., Member FINRA/SIPC.
TradingView is an independent third party not affiliated with Moomoo Financial Inc., Moomoo Technologies Inc., or its affiliates. Moomoo Financial Inc. and its affiliates do not endorse, represent or warrant the completeness and accuracy of the data and information available on the TradingView platform and are not responsible for any services provided by the third-party platform.
Disclaimer
The information and publications are not meant to be, and do not constitute, financial, investment, trading, or other types of advice or recommendations supplied or endorsed by TradingView. Read more in the Terms of Use.
Disclaimer
The information and publications are not meant to be, and do not constitute, financial, investment, trading, or other types of advice or recommendations supplied or endorsed by TradingView. Read more in the Terms of Use.