Long
MYROUSDT Bullish Breakout Above Triangle Resistance!
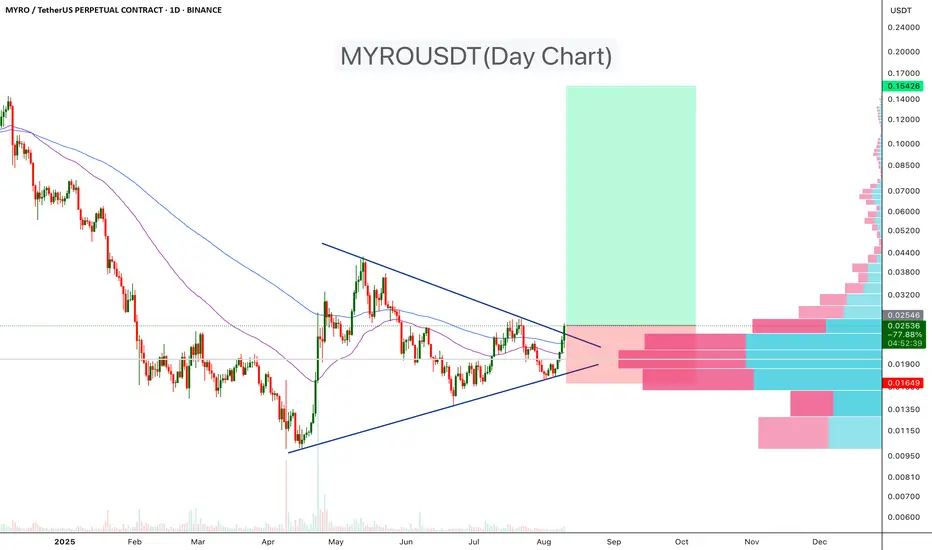
MYROUSDT has been trading within a symmetrical triangle pattern for the past few months. Today, the price has broken above the upper trendline, signaling a potential bullish breakout. The breakout is supported by increased volume and a clear move above both the 50-day and 100-day EMAs, suggesting strengthening bullish momentum.
Pattern: Symmetrical Triangle (Bullish breakout)
Breakout Confirmation: Price closed above the upper trendline with increased volume
Moving Averages: Trading above the 50 EMA and 100 EMA – bullish bias
Target: 150%–500%
Stop-loss: Below triangle support (~$0.0165)
Cheers
Hexa
Pattern: Symmetrical Triangle (Bullish breakout)
Breakout Confirmation: Price closed above the upper trendline with increased volume
Moving Averages: Trading above the 50 EMA and 100 EMA – bullish bias
Target: 150%–500%
Stop-loss: Below triangle support (~$0.0165)
Cheers
Hexa
🚀Telegram : t.me/hexatrades
🌐Website: hexatrades.io/
🗣️Twitter(X): twitter.com/HexaTrades
🌐Website: hexatrades.io/
🗣️Twitter(X): twitter.com/HexaTrades
Related publications
Disclaimer
The information and publications are not meant to be, and do not constitute, financial, investment, trading, or other types of advice or recommendations supplied or endorsed by TradingView. Read more in the Terms of Use.