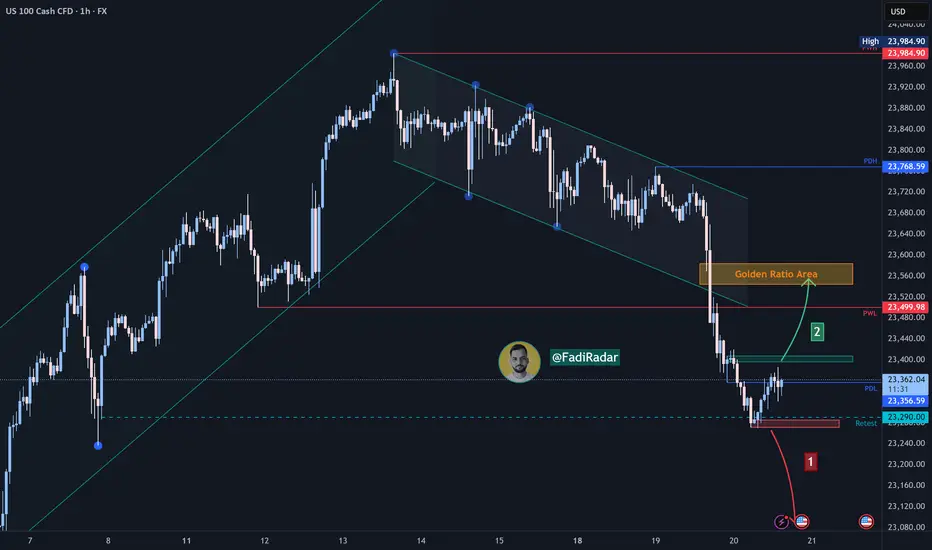
The index is moving in a bullish trend on the higher timeframes (Daily – H4), while showing a bearish move on the 1H timeframe. Currently, it is trading near the 23,340 area.
🔻 Bearish Scenario:
If the price breaks below 23,270 and holds, it may head to retest 23,080.
🔺 Bullish Scenario:
If the price manages to break and hold above 23,400, this could support a continuation towards 23,560 (a potential reversal zone – Fibonacci golden area). However, if buying momentum continues, the path could extend towards 23,680.
Disclaimer
The information and publications are not meant to be, and do not constitute, financial, investment, trading, or other types of advice or recommendations supplied or endorsed by TradingView. Read more in the Terms of Use.
Disclaimer
The information and publications are not meant to be, and do not constitute, financial, investment, trading, or other types of advice or recommendations supplied or endorsed by TradingView. Read more in the Terms of Use.