📊 NAS100 Forecast | Intraday & Swing Outlook 🚀📉 (11th Sept 2025)
🕵️ Market Context
🧩 Technical Framework
📈 Indicators Snapshot
⚡ Intraday Levels & Strategy
🔑 Buy Zone: 23,820 – 23,900 (pullback entry).
🎯 Targets: 24,150 / 24,300 / 24,450.
🛑 Stop Loss: Below 23,700.
⚠️ Bear Trap Alert: A dip under 23,800 with quick rebound signals strong accumulation.
🌀 Swing Trading Levels & Strategy
🔑 Buy Zone: 23,500 – 23,700.
🎯 Medium-Term Targets: 24,600 / 25,000 / 25,500.
🛑 Stop Loss: Below 23,300 (weekly close).
📌 If 24,750 breaks → bullish continuation toward 25,800.
❗ If 23,500 breaks → swing bias shifts bearish to 22,800.
📊 Pattern Watch
🦅 Head & Shoulders invalidated (bullish continuation favored).
🦋 Harmonic Bullish Gartley forming near 23,750 (PRZ zone).
🚨 Watch for Bull Trap above 24,300 → confirmation needed before chasing longs.
🧭 Final Outlook
💡 NAS100 traders should balance intraday momentum with swing accumulation zones. The broader structure favors upside continuation, but resistance at 24,300 must break cleanly for momentum to sustain.
For individuals seeking to enhance their trading abilities based on the analyses provided, I recommend exploring the mentoring program offered by Shunya Trade. (Website: shunya dot trade)
I would appreciate your feedback on this analysis, as it will serve as a valuable resource for future endeavors.
Sincerely,
Shunya.Trade
Website: shunya dot trade
🕵️ Market Context
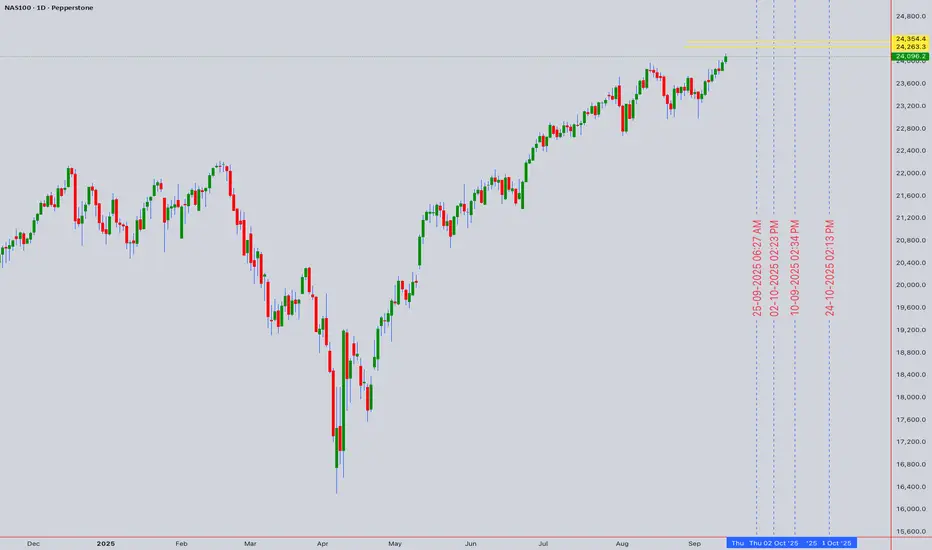
- NAS100 closed at 24,096.
- Global equities remain volatile due to inflation, Fed policy outlook, and tech earnings season.
- Short-term sentiment: Neutral to Slightly Bullish.
- Swing sentiment: Bullish while above 23,500 key support.
🧩 Technical Framework
- Candlesticks: Bullish engulfing spotted on H4, suggesting buyers defend 23,800 zone.
- Elliott Wave: Current move resembles Wave 3 extension with corrective pullbacks near 23,750–23,900.
- Wyckoff: Distribution signs absent, market in late accumulation.
- Gann Analysis: 24,200–24,250 forms a key resistance square.
- Ichimoku Cloud: Price above Kumo (H4/D1), bullish confirmation if 24,300 breaks.
- Support/Resistance:
Major Support: 23,500 / 23,750
Major Resistance: 24,300 / 24,750
📈 Indicators Snapshot
- RSI (H1): 58 → room to climb before overbought.
- Bollinger Bands: Price hugging upper band → momentum bullish, risk of overextension.
- VWAP (D1): Holding above daily VWAP → bullish bias intraday.
- MA Cross: 50 EMA > 200 EMA (Golden Cross) → swing uptrend intact.
⚡ Intraday Levels & Strategy
🔑 Buy Zone: 23,820 – 23,900 (pullback entry).
🎯 Targets: 24,150 / 24,300 / 24,450.
🛑 Stop Loss: Below 23,700.
⚠️ Bear Trap Alert: A dip under 23,800 with quick rebound signals strong accumulation.
🌀 Swing Trading Levels & Strategy
🔑 Buy Zone: 23,500 – 23,700.
🎯 Medium-Term Targets: 24,600 / 25,000 / 25,500.
🛑 Stop Loss: Below 23,300 (weekly close).
📌 If 24,750 breaks → bullish continuation toward 25,800.
❗ If 23,500 breaks → swing bias shifts bearish to 22,800.
📊 Pattern Watch
🦅 Head & Shoulders invalidated (bullish continuation favored).
🦋 Harmonic Bullish Gartley forming near 23,750 (PRZ zone).
🚨 Watch for Bull Trap above 24,300 → confirmation needed before chasing longs.
🧭 Final Outlook
- Intraday Bias: Buy dips toward 23,820–23,900.
- Swing Bias: Accumulate above 23,500 for 25,000+.
- Market remains buy-the-dip mode while above 23,500.
- Risk management 🔑: Keep SL tight as volatility persists.
💡 NAS100 traders should balance intraday momentum with swing accumulation zones. The broader structure favors upside continuation, but resistance at 24,300 must break cleanly for momentum to sustain.
For individuals seeking to enhance their trading abilities based on the analyses provided, I recommend exploring the mentoring program offered by Shunya Trade. (Website: shunya dot trade)
I would appreciate your feedback on this analysis, as it will serve as a valuable resource for future endeavors.
Sincerely,
Shunya.Trade
Website: shunya dot trade
I am nothing
Disclaimer
The information and publications are not meant to be, and do not constitute, financial, investment, trading, or other types of advice or recommendations supplied or endorsed by TradingView. Read more in the Terms of Use.
I am nothing
Disclaimer
The information and publications are not meant to be, and do not constitute, financial, investment, trading, or other types of advice or recommendations supplied or endorsed by TradingView. Read more in the Terms of Use.