Actionable Trading Framework
Bullish Scenario (Probability: 60%)
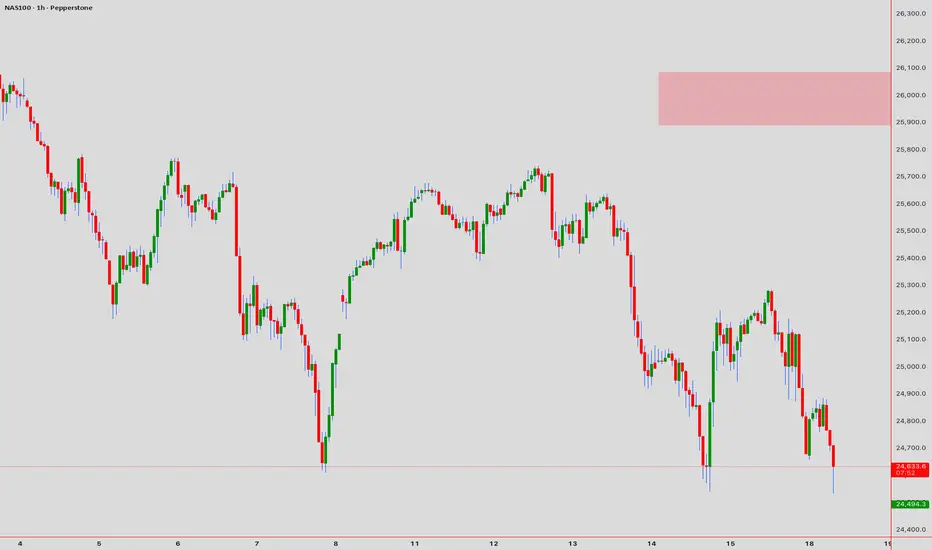
Entry: 24,595-24,620 (consolidation breach confirmation)
Target 1:24,680 (+$62 risk/reward)
Target 2: 24,750 (+$132 profit extension)
Stop Loss: 24,550 (-$45)
Trigger: Break above 24,650 with volume confirmation on 5/15-min charts
Bearish Scenario (Probability: 40%)
Entry: 24,680-24,710 (rejection candle formation)
Target 1: 24,600 (-$80 to +$30 range)
Target 2: 24,520 (-$160 reversal)
Stop Loss: 24,760 (+$50)
Trigger: Failed breakout attempt + RSI divergence on 1-hour chart
Key Technical Confluences
✓ EMA 20/50 Crossover Zone → Dynamic support (1-hour timeframe)
✓ VWAP Alignment → Acts as pivot point at 24,635
✓ Harmonic Pattern → Potential bullish AB=CD completion near current zone
✓ Ichimoku Tenkan-sen → Resistance pressure at 24,705
Execution Rules
1. Entry Confirmation: Engulfing or Pin Bar + Volume Spike on 5-min chart
2. Risk Management: Maximum risk per trade = 1% account size
3. Time Window: Optimal trading 08:00-15:00 UTC+4 (high liquidity period)
4. Exit Protocol: Trail stop at 15-pips after Target 1 achievement
Bullish Scenario (Probability: 60%)
Entry: 24,595-24,620 (consolidation breach confirmation)
Target 1:24,680 (+$62 risk/reward)
Target 2: 24,750 (+$132 profit extension)
Stop Loss: 24,550 (-$45)
Trigger: Break above 24,650 with volume confirmation on 5/15-min charts
Bearish Scenario (Probability: 40%)
Entry: 24,680-24,710 (rejection candle formation)
Target 1: 24,600 (-$80 to +$30 range)
Target 2: 24,520 (-$160 reversal)
Stop Loss: 24,760 (+$50)
Trigger: Failed breakout attempt + RSI divergence on 1-hour chart
Key Technical Confluences
✓ EMA 20/50 Crossover Zone → Dynamic support (1-hour timeframe)
✓ VWAP Alignment → Acts as pivot point at 24,635
✓ Harmonic Pattern → Potential bullish AB=CD completion near current zone
✓ Ichimoku Tenkan-sen → Resistance pressure at 24,705
Execution Rules
1. Entry Confirmation: Engulfing or Pin Bar + Volume Spike on 5-min chart
2. Risk Management: Maximum risk per trade = 1% account size
3. Time Window: Optimal trading 08:00-15:00 UTC+4 (high liquidity period)
4. Exit Protocol: Trail stop at 15-pips after Target 1 achievement
I am nothing @shunya.trade
Disclaimer
The information and publications are not meant to be, and do not constitute, financial, investment, trading, or other types of advice or recommendations supplied or endorsed by TradingView. Read more in the Terms of Use.
I am nothing @shunya.trade
Disclaimer
The information and publications are not meant to be, and do not constitute, financial, investment, trading, or other types of advice or recommendations supplied or endorsed by TradingView. Read more in the Terms of Use.