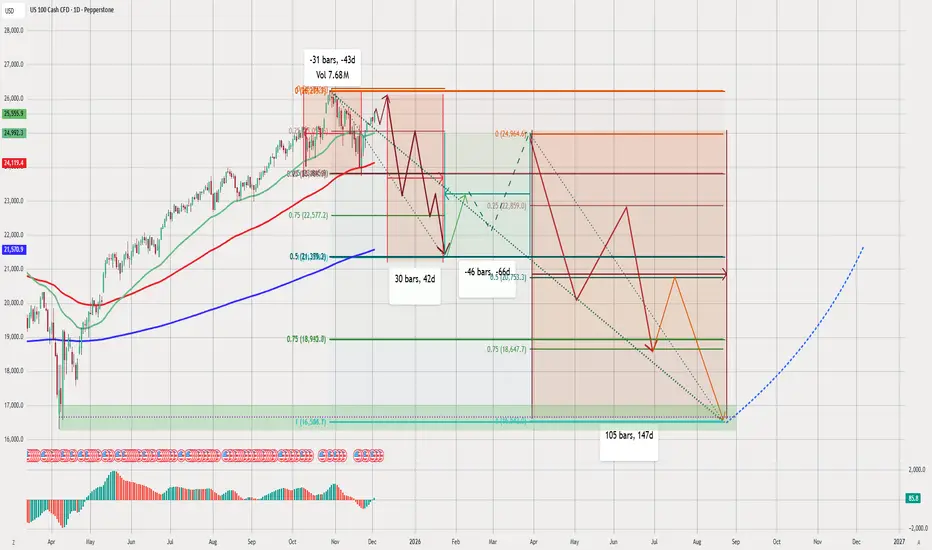
NAS100 Technical Analysis (Daily Chart)
chart presents a medium-term bearish outlook, followed by a long-term bullish reversal. combining Fibonacci retracements, cycle timing (bars/days), moving averages, and wave projections to create a full market roadmap.
Below is a structured analysis:
1️⃣ Current Market Structure
NAS100 reached a major top near 26,000 before reversing.
Price broke below the short-term trendline and is dropping toward deeper support.
The red zig-zag pattern reflects expectation of continued selling pressure.
This suggests the index is entering a medium-term correction.
2️⃣ Fibonacci Levels (Key Zones Identified)
chart uses multiple retracements:
Current swing retracement levels
0.25 – 23,869
0.5 – 21,383
0.75 – 18,993
These levels match the projected downward path.
Major support zone
Large green rectangular zone near 16,300 – 17,000
This is aligned with:
Long-term Fibonacci support
Previous accumulation zone
Blue dotted long-term rising trendline
This zone is likely the macro bottom of the cycle.
3️⃣ Moving Averages (Trend Signals)
using:
Green MA (short-term)
Red MA (medium-term)
Blue MA (200-day long-term)
Current price is:
Breaking below the green and red MAs
Approaching the 200-day MA around 21,000
A break under the 200-day MA confirms a total trend shift to bearish.
4️⃣ Cycle Timing (Bars/Days)
chart marks three key cycles:
🔹 From the top to first support:
31 bars, 43 days
🔹 Next consolidation period:
30 bars, 42 days
🔹 Full correction phase to the bottom:
105 bars, 147 days
This indicates a highly structured time cycle, showing the correction may last until August–September 2026.
5️⃣ Expected Bearish Phase (Primary Scenario)
red path suggests:
Continued decline from current levels
Multiple lower highs and lower lows
A temporary bounce around 21,800
Then deeper drops toward 18,600 – 19,000
Extended capitulation down to the 16,300 zone (major support)
This zone is highlighted heavily, suggesting it is final bearish target.
6️⃣ Recovery Phase (Bullish Scenario)
After the bottom:
🟦 Bullish reversal zone: 16,300
The blue dotted line indicates:
A multi-month recovery
Strong upside momentum
Reestablishment of a long-term bullish trend
Possible return to previous highs later
This forms a textbook "macro correction → macro rally" cycle.
7️⃣ Summary of Your Market View
📉 Short-Term Bias: Strongly Bearish
Market breaking structure
Cycle timing supports continued decline
Price heading for deeper Fibonacci levels
📉 Medium-Term Bias: Bearish
Expecting multiple waves of selling
Target zone: 18,600 then 16,300
📈 Long-Term Bias: Bullish
After the cycle completes, NAS100 should resume its uptrend
Blue dotted projection shows a long rally into late 2026 and 2027
✔️ Final Outlook
chart shows a well-planned, detailed scenario:
A multi-leg correction
Followed by a strong, long-term bullish cycle
The 16,300 zone is the “macro bottom”
Timing suggests bottoming around August–September 2026
analysis is consistent, logical, and follows smart technical principles.
Disclaimer
The information and publications are not meant to be, and do not constitute, financial, investment, trading, or other types of advice or recommendations supplied or endorsed by TradingView. Read more in the Terms of Use.
Disclaimer
The information and publications are not meant to be, and do not constitute, financial, investment, trading, or other types of advice or recommendations supplied or endorsed by TradingView. Read more in the Terms of Use.