🕰 Weekly View (Big Picture)
The Elliott Wave structure is playing out cleanly:
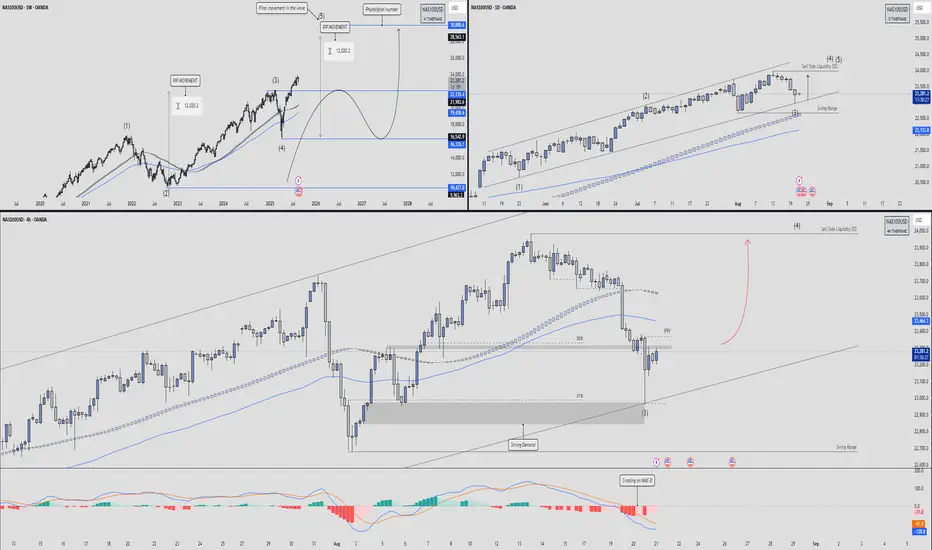
Wave (1) topped → Wave (2) corrective pullback.
Wave (3) extended strongly, now we’re inside Wave (5).
Price is showing final movement within the wave cycle, meaning the index is likely topping out.
A measured move of ~12,000 pips matches the symmetry between Waves (1–3) and (3–5).
Key downside retracement zones:
21,133 – 19,736 → first major support block.
16,352 – 16,351 → deeper retracement zone if momentum collapses.
Ultimate liquidity magnet sits around 10,427, but that’s long-term.
📉 Daily Structure
Market traded inside a rising channel, with the last leg forming Wave (5).
Current price action is rejecting sell-side liquidity, hinting at weakness.
Breakdown of the swing range → momentum shift underway.
Strong support rests near 22,133, aligning with the 200 EMA cluster.
Loss of that level = higher probability of completing Wave (4) retracement.
⏱ 4H Breakdown
The 4H chart shows the short-term battle:
Price wicked into the 71% retracement and tapped strong demand.
Currently consolidating inside a corrective bounce zone.
The 50% retracement and IPH level (~23,450) act as immediate resistance.
Expectation:
If supply holds, we rotate lower to re-test demand at 23,000 – 22,800.
If buyers defend, a relief push into 23,600 – 23,800 is possible before selling resumes.
🎯 Trade Plan
Bias: Short-to-mid term bearish (retracement phase of Wave (5)).
Entry Zone: Look for rejection around 23,450 – 23,600.
Target Zones:
First take profit → 23,000 – 22,800 demand.
Secondary target → 22,133 swing level.
Invalidation: A clean break and hold above 23,800 – 24,000 would re-open bullish continuation.
Risk Management: Trade within the channel structure, size down due to volatility.
The Elliott Wave structure is playing out cleanly:
Wave (1) topped → Wave (2) corrective pullback.
Wave (3) extended strongly, now we’re inside Wave (5).
Price is showing final movement within the wave cycle, meaning the index is likely topping out.
A measured move of ~12,000 pips matches the symmetry between Waves (1–3) and (3–5).
Key downside retracement zones:
21,133 – 19,736 → first major support block.
16,352 – 16,351 → deeper retracement zone if momentum collapses.
Ultimate liquidity magnet sits around 10,427, but that’s long-term.
📉 Daily Structure
Market traded inside a rising channel, with the last leg forming Wave (5).
Current price action is rejecting sell-side liquidity, hinting at weakness.
Breakdown of the swing range → momentum shift underway.
Strong support rests near 22,133, aligning with the 200 EMA cluster.
Loss of that level = higher probability of completing Wave (4) retracement.
⏱ 4H Breakdown
The 4H chart shows the short-term battle:
Price wicked into the 71% retracement and tapped strong demand.
Currently consolidating inside a corrective bounce zone.
The 50% retracement and IPH level (~23,450) act as immediate resistance.
Expectation:
If supply holds, we rotate lower to re-test demand at 23,000 – 22,800.
If buyers defend, a relief push into 23,600 – 23,800 is possible before selling resumes.
🎯 Trade Plan
Bias: Short-to-mid term bearish (retracement phase of Wave (5)).
Entry Zone: Look for rejection around 23,450 – 23,600.
Target Zones:
First take profit → 23,000 – 22,800 demand.
Secondary target → 22,133 swing level.
Invalidation: A clean break and hold above 23,800 – 24,000 would re-open bullish continuation.
Risk Management: Trade within the channel structure, size down due to volatility.
Disclaimer
The information and publications are not meant to be, and do not constitute, financial, investment, trading, or other types of advice or recommendations supplied or endorsed by TradingView. Read more in the Terms of Use.
Disclaimer
The information and publications are not meant to be, and do not constitute, financial, investment, trading, or other types of advice or recommendations supplied or endorsed by TradingView. Read more in the Terms of Use.