📉 Current Market Structure & Interpretation
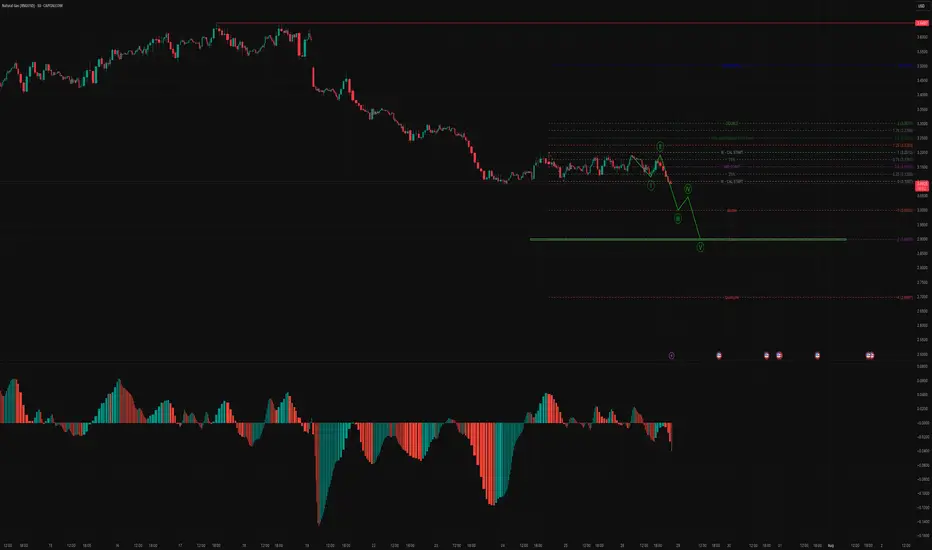
🟢 Elliott Wave Count (Bearish Impulse in Progress)
The chart suggests a 1-2-3-4-5 impulsive wave is unfolding on the downside.
Currently, NG appears to have completed Wave 2 (retracement) and Wave 3 is in progress, heading toward a major breakdown.
The structure projects Wave 3 → Wave 4 pullback → Wave 5 final leg.
🔍 Fibonacci & Key Levels (Bearish Projections)
Wave 3 Target Zone:
-1.0 Fib Extension (~3.00) marked as "double"
Strong support break zone; high probability breakdown confirmation
Wave 5 Completion Target:
-2.0 Fib Extension (~2.807) highlighted as major support
Also aligns with a long-term base/accumulation zone
Extreme Bearish Target:
-4.23 Fib (~2.687) – only in case of panic sell-off (marked “Quintuple”)
📊 Volume & MACD Histogram (Lower Panel)
Strong bearish momentum in MACD histogram: red bars extending and deepening.
Bearish volume expansion visible during Wave 1 and Wave 3 fall, validating impulsive nature.
No sign of volume divergence yet – supports continuation.
🔄 Retracement & Pullback Zones
Wave 4 likely to pull back between:
0.25–0.382 retracement of Wave 3
Could test the area around 3.04–3.08, before turning back down
⚠️ Invalidation & Risk Level
If price breaks above 3.13–3.16 (0.618 level of the total fall), wave count may get invalidated.
Otherwise, structure remains bearish.
🎯 Short-Term Trade Plan (Bias: Bearish)
Aspect Details
Entry Zone Any pullback near 3.04–3.08 (Wave 4 zone)
Target 1 3.00 (Wave 3 completion)
Target 2 2.807 (Wave 5 final target)
SL/Invalidation Above 3.13–3.16
Trade Type Short / Put Option / Futures Sell
Bias Intraday to Short-Term Positional
✅ Conclusion
The chart shows a well-structured Elliott bearish impulse, currently in progress with strong downside momentum. Expect further continuation toward 2.80 zone, barring any invalidation above 3.13. The Fibonacci confluence and momentum support this outlook.
Disclaimer:
This analysis is for educational and informational purposes only and should not be considered as financial or investment advice. Trading in commodities, options, and futures involves substantial risk and may not be suitable for all investors. Always conduct your own research and consult with a qualified financial advisor before making any trading decisions. The author or publisher is not responsible for any losses incurred from trading decisions based on this analysis.
Disclaimer
The information and publications are not meant to be, and do not constitute, financial, investment, trading, or other types of advice or recommendations supplied or endorsed by TradingView. Read more in the Terms of Use.
Disclaimer
The information and publications are not meant to be, and do not constitute, financial, investment, trading, or other types of advice or recommendations supplied or endorsed by TradingView. Read more in the Terms of Use.