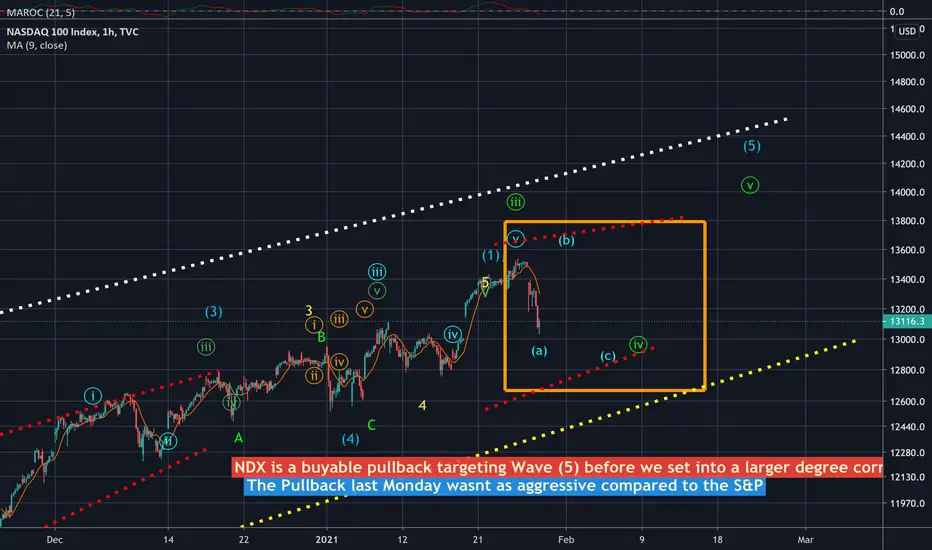
The same predicament exists in the NDX as the SPX. On the hourly chart, we’re seeing a corrective (a), (b), (c) pullback and we may be contained within in the highlighted range in W/ Orange rectangle before completing once terminal move higher into wave v.
Disclaimer
The information and publications are not meant to be, and do not constitute, financial, investment, trading, or other types of advice or recommendations supplied or endorsed by TradingView. Read more in the Terms of Use.
Disclaimer
The information and publications are not meant to be, and do not constitute, financial, investment, trading, or other types of advice or recommendations supplied or endorsed by TradingView. Read more in the Terms of Use.