Hi,
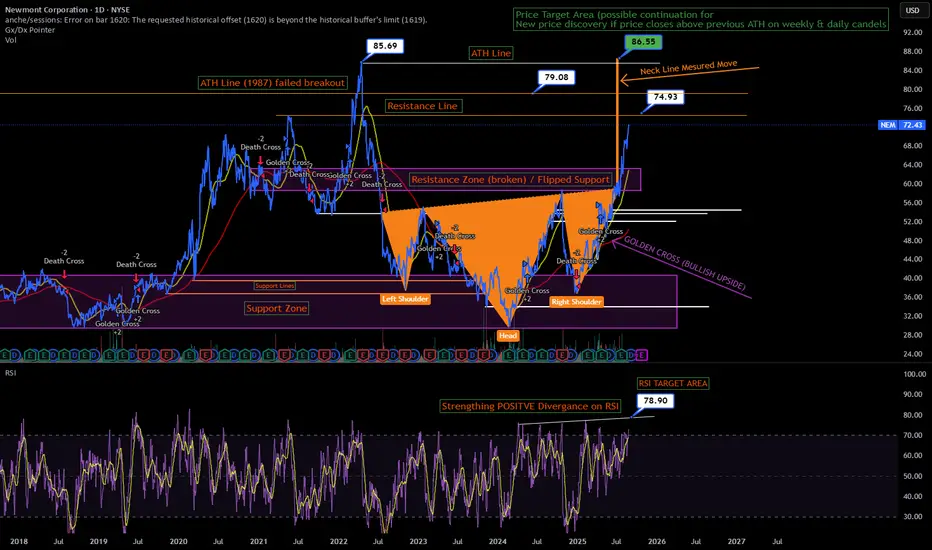
I actually spotted this a while ago and have keep this on the quiet but i am excited to share my first publication, This represents a clear "Ascending Inverse Head and Shoulders" with a slight favor to the upside.
I have set some price targets around potential Resistance levels also there was a double top since 1987 where if broken a harder move higher is likely to align with the Neckline measured move, Time wise i believe this will finish some time in Late November to early February in 2026.
Look to a pullback in RSI to see when the bullish buying and strength fades away but it will be excellent to see a conformation with some closes above the previous ATH on the 1 day or weekly candle charts. the golden Cross moving averages are with the 50 day vs the 200 day cross over indicating that a bullish golden cross is in full effect, i expect the measured move to complete along side some minor pull backs around the resistance levels, those dips should be brought into with strategic profit taking around the key levels, I wouldn't say exit NEM after completion more profit take and remain cautious until conformation of a new confirmed ATH breakout. 2026 could see a continuation grind to new heights around $100+ per share but will need to reinvestigate the double top breakout once played out after EOY.
Regards R.
Disclaimer
The information and publications are not meant to be, and do not constitute, financial, investment, trading, or other types of advice or recommendations supplied or endorsed by TradingView. Read more in the Terms of Use.
Disclaimer
The information and publications are not meant to be, and do not constitute, financial, investment, trading, or other types of advice or recommendations supplied or endorsed by TradingView. Read more in the Terms of Use.