NIFTY Technical Analysis
1. Fibonacci Levels
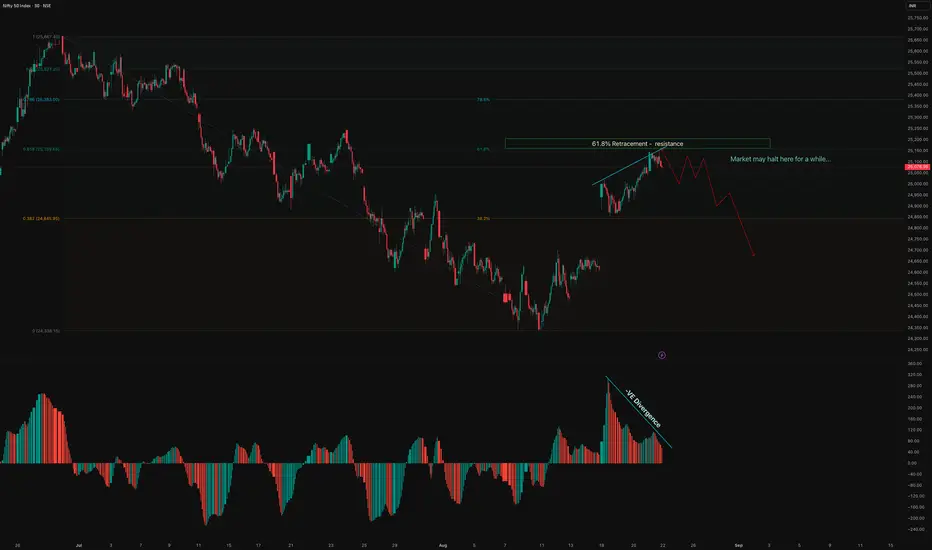
The index has retraced back to the 61.8% retracement zone (classic resistance level).
Price is showing hesitation around this level, indicating potential supply pressure.
2. Volume & Momentum Divergence
Negative volume divergence (-VE Divergence) is visible, suggesting momentum is weakening despite higher prices.
This divergence often signals a potential short-term reversal.
3. Expected Market Behavior
The market may halt/sideways consolidate near this 61.8% zone for a while.
If rejection strengthens, downside targets could open toward:
24,850 (38.2% level) as first support
Further downside risk if momentum builds below that level.
4. Trade Outlook
Bias: Bearish/Neutral near resistance
Watch for rejection candles and breakdown confirmation before shorting.
Swing Traders: A close below 24,850 may confirm continuation toward lower Fibonacci zones.
⚠️ Disclaimer
This analysis is for educational purposes only and is not financial advice. Trading in equities and derivatives involves significant risk. Please consult your financial advisor before making any investment or trading decisions.
1. Fibonacci Levels
The index has retraced back to the 61.8% retracement zone (classic resistance level).
Price is showing hesitation around this level, indicating potential supply pressure.
2. Volume & Momentum Divergence
Negative volume divergence (-VE Divergence) is visible, suggesting momentum is weakening despite higher prices.
This divergence often signals a potential short-term reversal.
3. Expected Market Behavior
The market may halt/sideways consolidate near this 61.8% zone for a while.
If rejection strengthens, downside targets could open toward:
24,850 (38.2% level) as first support
Further downside risk if momentum builds below that level.
4. Trade Outlook
Bias: Bearish/Neutral near resistance
Watch for rejection candles and breakdown confirmation before shorting.
Swing Traders: A close below 24,850 may confirm continuation toward lower Fibonacci zones.
⚠️ Disclaimer
This analysis is for educational purposes only and is not financial advice. Trading in equities and derivatives involves significant risk. Please consult your financial advisor before making any investment or trading decisions.
Disclaimer
The information and publications are not meant to be, and do not constitute, financial, investment, trading, or other types of advice or recommendations supplied or endorsed by TradingView. Read more in the Terms of Use.
Disclaimer
The information and publications are not meant to be, and do not constitute, financial, investment, trading, or other types of advice or recommendations supplied or endorsed by TradingView. Read more in the Terms of Use.