🔍 Technical Structure
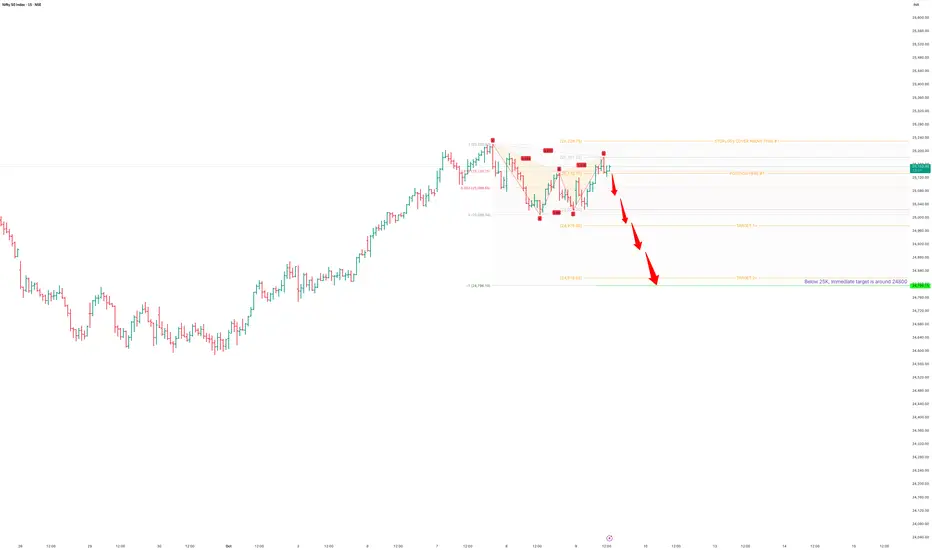
The chart forms a bearish ABCD harmonic pattern, with the “D” completion zone aligning near 25,200–25,250, which also coincides with the 61.8% Fibonacci retracement of the prior downswing. This zone acted as a supply area — rejection here confirms sellers’ re-entry.
📉 Key Levels
Type Level Description
Entry / Position Zone 25,150–25,200 Short entry region (as marked)
Stop-Loss Zone Above 25,250 Invalidates the pattern if broken
Target 1 24,875 Corresponds to the 100% Fib projection of the BC leg
Target 2 24,470–24,480 Aligns with the 127.2% Fibonacci extension – high-probability completion zone.
🧭 Conclusion
Below 25,000, the index is likely to trigger accelerated profit-booking toward 24,800, and if momentum persists, an extension to 24,470 is statistically justified. Any close above 25,250 invalidates the bearish setup and calls for reassessment.
Disclaimer:
This analysis is purely for educational and informational purposes based on technical chart interpretation and publicly available market data. It does not constitute financial or investment advice. Trading in equities, derivatives, or indices involves significant risk, and past performance or statistical probability does not guarantee future results. Please consult your financial advisor before making any trading or investment decisions.
Disclaimer
The information and publications are not meant to be, and do not constitute, financial, investment, trading, or other types of advice or recommendations supplied or endorsed by TradingView. Read more in the Terms of Use.
Disclaimer
The information and publications are not meant to be, and do not constitute, financial, investment, trading, or other types of advice or recommendations supplied or endorsed by TradingView. Read more in the Terms of Use.