📌 Rolling VWAP Indicator – Performance on Nifty (15-Min)
How it Behaves in Real Market Structure
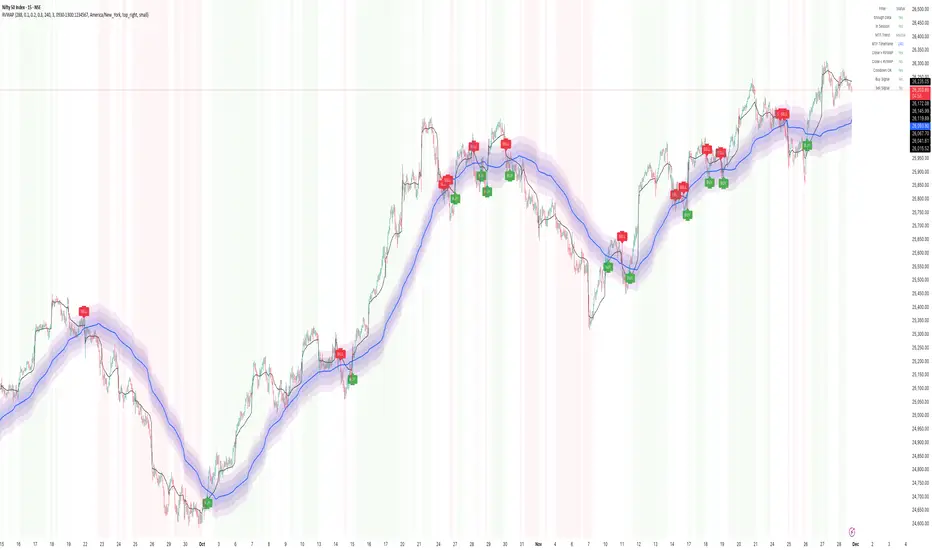
The Rolling VWAP indicator showcased here acts like a dynamic trend map, continuously recalculating volume-weighted averages over rolling windows. This helps the indicator adapt quickly to evolving intraday sentiment without getting stuck like a fixed-session VWAP.
Based on the attached Nifty 15-minute chart, here are the key observations:
1️⃣ Captures Trend Early & Smoothly
During strong directional phases (example: the mid-October uptrend and late-November rally), Rolling VWAP bands align beautifully with price:
• Price rides above the VWAP → sustained long bias
• Bands expand → trend strength
• Pullbacks respect the mid-VWAP zone → clean continuation signals
This allows traders to stay confidently in trending conditions.
⸻
2️⃣ Effective Reversal Spotting
The indicator prints clear reversal signals when:
• Price closes on the opposite side of the VWAP channel
• Band slope flips
• Background color switches sentiment
On the chart, almost every major swing—both tops and bottoms—was marked by timely reversal signals, allowing traders to exit early and flip positions with minimal lag.
⸻
3️⃣ Filters Out Low-Probability Zones
The shaded grey bands are extremely useful:
• They signify uncertain or transition zones
• Price inside this grey zone = Avoid trades
• Prevents traders from forcing entries during choppy consolidation
You can clearly see that avoiding these grey-zone candles eliminates many false breakouts.
⸻
4️⃣ Strong Performance in Volatile Retracements
Whenever price dipped sharply into the lower VWAP band during downswings, the indicator generated:
• Fast reversal confirmation (green markers)
• Early re-entry opportunities
• Clean identification of exhaustion points
This is visible near month-end corrections and early-October recovery.
⸻
5️⃣ Eliminates False Breakouts
One of the biggest advantages—
When price fakes a breakout and slips back into the band, the VWAP slope + sentiment shading instantly catches it.
You can see several red signals printed at failed upside attempts, preventing continuation trades that would otherwise trap traders.
⸻
6️⃣ Stable in Ranging Markets
Even in sideways phases, the Rolling VWAP structure:
• Narrow bands → low volatility awareness
• Light background shading → caution signals
• Very limited signals → avoids unnecessary trades
This keeps traders out of low-reward zones.
⸻
✨ Summary – Why It Works Well
➡️ Dynamic VWAP adapts faster than traditional VWAP
➡️ Clear trend detection with multi-layer bands
➡️ Reliable reversal confirmations
➡️ Grey no-trade zones prevent unnecessary entries
➡️ Visually intuitive sentiment shading
➡️ Works beautifully on index charts like Nifty and BankNifty
The overall performance on Nifty 15-min shows high consistency across trends, reversals, and retracements, making it a practical tool for intraday and positional index traders.
How it Behaves in Real Market Structure
The Rolling VWAP indicator showcased here acts like a dynamic trend map, continuously recalculating volume-weighted averages over rolling windows. This helps the indicator adapt quickly to evolving intraday sentiment without getting stuck like a fixed-session VWAP.
Based on the attached Nifty 15-minute chart, here are the key observations:
1️⃣ Captures Trend Early & Smoothly
During strong directional phases (example: the mid-October uptrend and late-November rally), Rolling VWAP bands align beautifully with price:
• Price rides above the VWAP → sustained long bias
• Bands expand → trend strength
• Pullbacks respect the mid-VWAP zone → clean continuation signals
This allows traders to stay confidently in trending conditions.
⸻
2️⃣ Effective Reversal Spotting
The indicator prints clear reversal signals when:
• Price closes on the opposite side of the VWAP channel
• Band slope flips
• Background color switches sentiment
On the chart, almost every major swing—both tops and bottoms—was marked by timely reversal signals, allowing traders to exit early and flip positions with minimal lag.
⸻
3️⃣ Filters Out Low-Probability Zones
The shaded grey bands are extremely useful:
• They signify uncertain or transition zones
• Price inside this grey zone = Avoid trades
• Prevents traders from forcing entries during choppy consolidation
You can clearly see that avoiding these grey-zone candles eliminates many false breakouts.
⸻
4️⃣ Strong Performance in Volatile Retracements
Whenever price dipped sharply into the lower VWAP band during downswings, the indicator generated:
• Fast reversal confirmation (green markers)
• Early re-entry opportunities
• Clean identification of exhaustion points
This is visible near month-end corrections and early-October recovery.
⸻
5️⃣ Eliminates False Breakouts
One of the biggest advantages—
When price fakes a breakout and slips back into the band, the VWAP slope + sentiment shading instantly catches it.
You can see several red signals printed at failed upside attempts, preventing continuation trades that would otherwise trap traders.
⸻
6️⃣ Stable in Ranging Markets
Even in sideways phases, the Rolling VWAP structure:
• Narrow bands → low volatility awareness
• Light background shading → caution signals
• Very limited signals → avoids unnecessary trades
This keeps traders out of low-reward zones.
⸻
✨ Summary – Why It Works Well
➡️ Dynamic VWAP adapts faster than traditional VWAP
➡️ Clear trend detection with multi-layer bands
➡️ Reliable reversal confirmations
➡️ Grey no-trade zones prevent unnecessary entries
➡️ Visually intuitive sentiment shading
➡️ Works beautifully on index charts like Nifty and BankNifty
The overall performance on Nifty 15-min shows high consistency across trends, reversals, and retracements, making it a practical tool for intraday and positional index traders.
Thanks.
TradeTech Analysis
Telegram Channel - t.me/Tradetech2024
Youtube Channel - youtube.com/@TradeTechAnalysis
Website - tradetechanalysis.com/
Super Profile - superprofile.bio/tradetechanalysis
TradeTech Analysis
Telegram Channel - t.me/Tradetech2024
Youtube Channel - youtube.com/@TradeTechAnalysis
Website - tradetechanalysis.com/
Super Profile - superprofile.bio/tradetechanalysis
Related publications
Disclaimer
The information and publications are not meant to be, and do not constitute, financial, investment, trading, or other types of advice or recommendations supplied or endorsed by TradingView. Read more in the Terms of Use.