Nifty
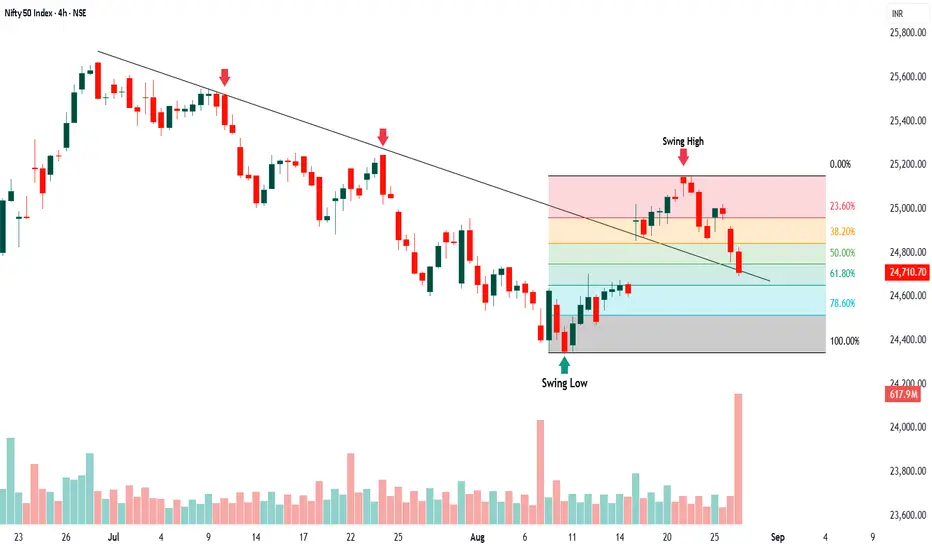
A trendline is drawn connecting the recent swing highs, indicating a clear downward trend in the market during the observed period. The price consistently fails to break above this line, confirming strong resistance and the dominance of sellers. Red arrows mark key points where the price tested but could not cross the trendline, suggesting repeated rejection at these levels.
Fibonacci Retracement Insights:
The chart leverages Fibonacci retracement from the swing low to the swing high, helping identify possible support levels during a pullback. Key retracement levels (23.6%, 38.2%, 50%, 61.8%, and 78.6%) highlight zones where buyers might step in or sellers could intensify pressure. Notice how the price recently moved down near the 61.8% retracement zone—this level often acts as a critical decision point for traders deciding between reversals or further downside.
Volume Interpretation
Volume bars at the chart’s bottom show the intensity of buying and selling activity. Larger red bars indicate increased selling pressure, especially around the most recent price drop. Monitoring volume alongside price movements and technical indicators gives deeper insights into the strength of market moves—high volume during downward moves reinforces the bearish conviction suggested by the trendline and Fibonacci retracement signals.
Conclusion:
Trendline: Acts as strong resistance, marking where sellers consistently regain control.
Fibonacci Retracement: Identifies important support zones; the 61.8% level is crucial here.
Volume: Elevated sell volumes confirm bearish sentiment and support the technical signals.
Disclaimer
The information and publications are not meant to be, and do not constitute, financial, investment, trading, or other types of advice or recommendations supplied or endorsed by TradingView. Read more in the Terms of Use.
Disclaimer
The information and publications are not meant to be, and do not constitute, financial, investment, trading, or other types of advice or recommendations supplied or endorsed by TradingView. Read more in the Terms of Use.