The Nifty 50 opened with a gap-up of 165 points (0.71%) and ended the week at 23,519.35 (0.72%), forming a long upper shadow candle on the weekly timeframe.
Understanding the Long Upper Shadow Candle
A long upper shadow candle suggests that Nifty attempted to move higher but faced strong selling pressure, causing it to close significantly lower than its weekly high. This pattern indicates:
If Nifty sustains below 23,443, selling pressure may increase. However, a move above 23,597 could restore bullish momentum.
Key Levels for the Upcoming Week
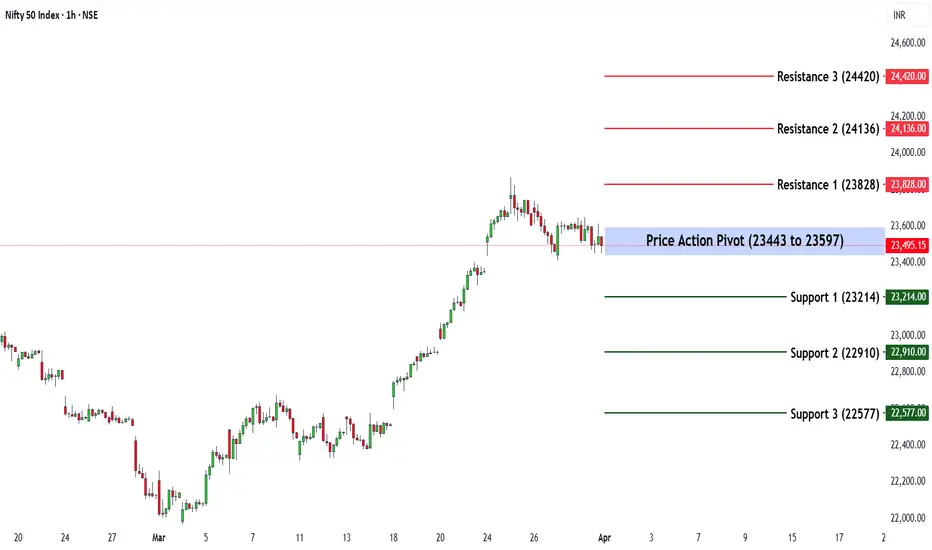
🔹 Price Action Pivot Zone:
The crucial range to watch for potential trend reversals or continuation is 23,443 - 23,597.
🔹 Support & Resistance Levels:
Support:
S1: 23,214
S2: 22,910
S3: 22,577
Resistance:
R1: 23,828
R2: 24,136
R3: 24,420
Market Outlook
✅ Bullish Scenario: A sustained breakout above 23,597 could attract buying momentum, driving Nifty towards R1 (23,828) and beyond.
❌ Bearish Scenario: A drop below 23,443 may trigger selling pressure, pushing Nifty towards S1 (23,214) or lower.
Disclaimer: This analysis is for educational purposes only. Investors should conduct their own research before making any trading decisions.
Understanding the Long Upper Shadow Candle
A long upper shadow candle suggests that Nifty attempted to move higher but faced strong selling pressure, causing it to close significantly lower than its weekly high. This pattern indicates:
- Bearish Rejection at Higher Levels– Buyers pushed prices up, but selling pressure forced a pullback, showing weakness at higher levels.
- Potential Trend Reversal or Weakness – If followed by a bearish candle, it may signal further downside or correction.
- Indecisiveness & Profit Booking – The formation suggests hesitation among traders, possibly due to profit booking by institutional investors.
If Nifty sustains below 23,443, selling pressure may increase. However, a move above 23,597 could restore bullish momentum.
Key Levels for the Upcoming Week
🔹 Price Action Pivot Zone:
The crucial range to watch for potential trend reversals or continuation is 23,443 - 23,597.
🔹 Support & Resistance Levels:
Support:
S1: 23,214
S2: 22,910
S3: 22,577
Resistance:
R1: 23,828
R2: 24,136
R3: 24,420
Market Outlook
✅ Bullish Scenario: A sustained breakout above 23,597 could attract buying momentum, driving Nifty towards R1 (23,828) and beyond.
❌ Bearish Scenario: A drop below 23,443 may trigger selling pressure, pushing Nifty towards S1 (23,214) or lower.
Disclaimer: This analysis is for educational purposes only. Investors should conduct their own research before making any trading decisions.
Disclaimer
The information and publications are not meant to be, and do not constitute, financial, investment, trading, or other types of advice or recommendations supplied or endorsed by TradingView. Read more in the Terms of Use.
Disclaimer
The information and publications are not meant to be, and do not constitute, financial, investment, trading, or other types of advice or recommendations supplied or endorsed by TradingView. Read more in the Terms of Use.