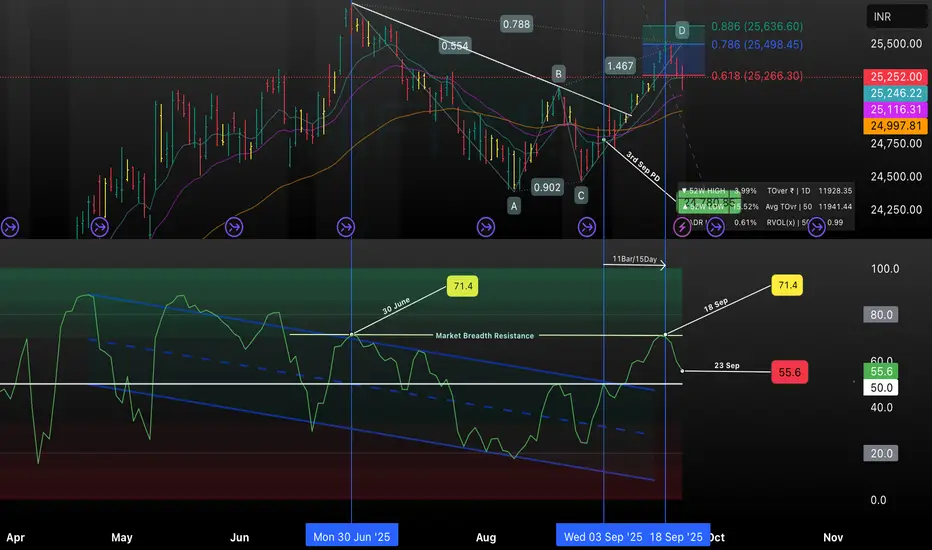
This chart highlights a bearish harmonic setup forming on NIFTY’s daily timeframe, with key confluence at the 0.618 and 0.786 Fibonacci retracement levels. A descending trendline and ABCD points are marked, exposing short-term reversal probability. The RSI indicator shows clear rejection at the 71.4 ‘Market Breadth Resistance’ zone on both June 30 and September 18, 2025, followed by a sharp drop to 55.6 as of September 23. This confluence signals caution for bullish momentum, with support/resistance and volume metrics also annotated for clarity.
Disclaimer
The information and publications are not meant to be, and do not constitute, financial, investment, trading, or other types of advice or recommendations supplied or endorsed by TradingView. Read more in the Terms of Use.
Disclaimer
The information and publications are not meant to be, and do not constitute, financial, investment, trading, or other types of advice or recommendations supplied or endorsed by TradingView. Read more in the Terms of Use.