Technical View: NIITMTS (NIIT Learning Systems Ltd.)
Trend Overview
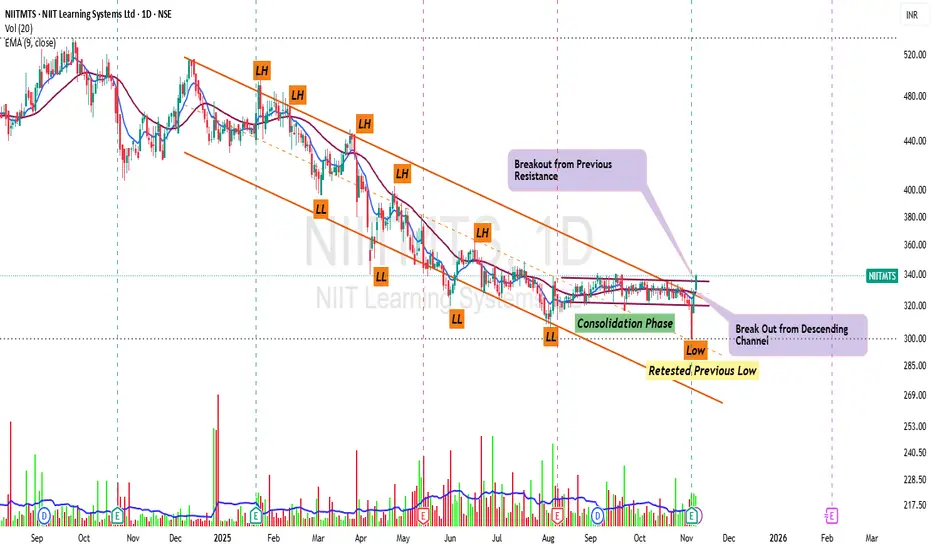
• The stock had been in a prolonged downtrend since early 2025, consistently forming Lower Highs (LH) and Lower Lows (LL) inside a descending channel.
• Recently, the stock has broken out of this descending channel — a strong bullish reversal signal.
• The breakout is supported by increasing volume, adding credibility to the move.
Price Action
• Current Price: ₹339.10
• Today’s Move: +₹10.80 (+3.29%)
• The stock broke out above previous resistance near ₹330–₹335, which had capped price action for several weeks.
• Consolidation Phase: Between ₹305–₹335 — the price successfully built a base before the breakout.
• Next Resistance Levels:
o ₹350 – minor resistance (psychological & short-term)
o ₹370 – previous swing high and major breakout confirmation level
• Support Zones:
o Immediate: ₹325 (near EMA & breakout retest zone)
o Strong: ₹305 (bottom of the consolidation phase)
Indicators
EMA (9, close)
• EMA: ₹327.86
• Price is sustaining above EMA — indicating short-term bullish momentum.
• EMA slope has turned upward, confirming trend reversal initiation.
RSI (14)
• RSI = 62.09 — momentum shifting from neutral to bullish.
• The RSI has broken above 60 after months of sideways action — an early sign of strength regeneration.
• As long as RSI stays above 55, positive momentum is likely to continue.
Volume Analysis
• Volume: 200K vs average 129K — a volume spike confirming active participation in the breakout.
• This volume behavior aligns with a valid breakout scenario after long accumulation.
Pattern Observation
• The chart depicts a Descending Channel Breakout — a bullish reversal pattern.
• The price also cleared horizontal resistance around ₹330, confirming a double breakout (trendline + price barrier).
• The consolidation phase prior to the breakout strengthens the reliability of this move.
• A sustained close above ₹340 could lead to trend reversal confirmation and trigger a move toward ₹360–₹380 levels.
Targets & Support
• Target 1: ₹350
• Target 2: ₹370–₹380
• Support 1: ₹325
• Support 2: ₹305
• Stop Loss: ₹320 (closing basis)
Disclaimer
This analysis is for educational purposes only and not a buy/sell recommendation.
Please conduct your own analysis or consult a financial advisor before investing.
Trend Overview
• The stock had been in a prolonged downtrend since early 2025, consistently forming Lower Highs (LH) and Lower Lows (LL) inside a descending channel.
• Recently, the stock has broken out of this descending channel — a strong bullish reversal signal.
• The breakout is supported by increasing volume, adding credibility to the move.
Price Action
• Current Price: ₹339.10
• Today’s Move: +₹10.80 (+3.29%)
• The stock broke out above previous resistance near ₹330–₹335, which had capped price action for several weeks.
• Consolidation Phase: Between ₹305–₹335 — the price successfully built a base before the breakout.
• Next Resistance Levels:
o ₹350 – minor resistance (psychological & short-term)
o ₹370 – previous swing high and major breakout confirmation level
• Support Zones:
o Immediate: ₹325 (near EMA & breakout retest zone)
o Strong: ₹305 (bottom of the consolidation phase)
Indicators
EMA (9, close)
• EMA: ₹327.86
• Price is sustaining above EMA — indicating short-term bullish momentum.
• EMA slope has turned upward, confirming trend reversal initiation.
RSI (14)
• RSI = 62.09 — momentum shifting from neutral to bullish.
• The RSI has broken above 60 after months of sideways action — an early sign of strength regeneration.
• As long as RSI stays above 55, positive momentum is likely to continue.
Volume Analysis
• Volume: 200K vs average 129K — a volume spike confirming active participation in the breakout.
• This volume behavior aligns with a valid breakout scenario after long accumulation.
Pattern Observation
• The chart depicts a Descending Channel Breakout — a bullish reversal pattern.
• The price also cleared horizontal resistance around ₹330, confirming a double breakout (trendline + price barrier).
• The consolidation phase prior to the breakout strengthens the reliability of this move.
• A sustained close above ₹340 could lead to trend reversal confirmation and trigger a move toward ₹360–₹380 levels.
Targets & Support
• Target 1: ₹350
• Target 2: ₹370–₹380
• Support 1: ₹325
• Support 2: ₹305
• Stop Loss: ₹320 (closing basis)
Disclaimer
This analysis is for educational purposes only and not a buy/sell recommendation.
Please conduct your own analysis or consult a financial advisor before investing.
Disclaimer
The information and publications are not meant to be, and do not constitute, financial, investment, trading, or other types of advice or recommendations supplied or endorsed by TradingView. Read more in the Terms of Use.
Disclaimer
The information and publications are not meant to be, and do not constitute, financial, investment, trading, or other types of advice or recommendations supplied or endorsed by TradingView. Read more in the Terms of Use.