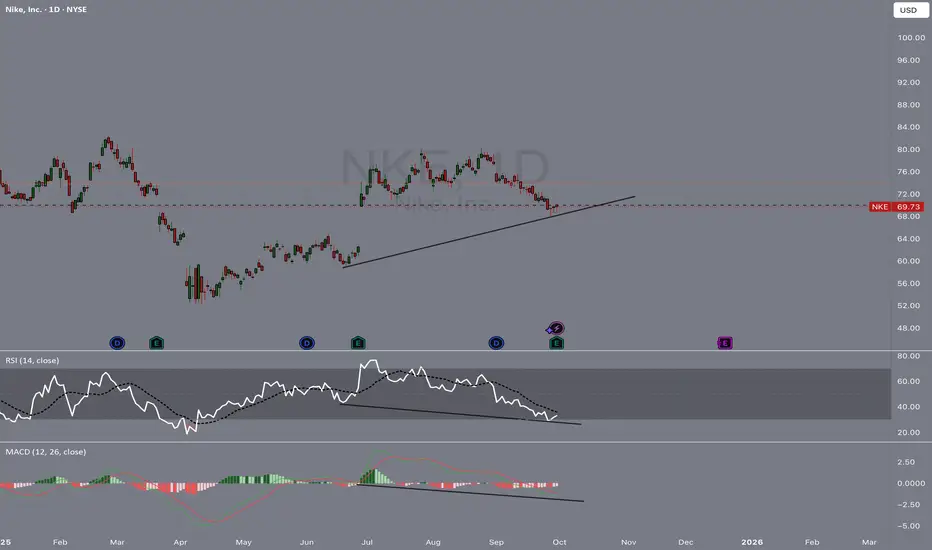
Price Action
- NKE has been in a downtrend, recently pulling back to trendline support around $69–$70.
- Price is testing this support zone, which aligns with prior structure.
Support & Resistance
- Key support: $69–$70 (trendline + horizontal level)
- Resistance: $73–$75 (recent breakdown zone)
RSI (Relative Strength Index)
- RSI (14) in a downtrend but showing bullish divergence (higher lows vs price making lower lows)
- Suggests potential bounce from oversold territory.
MACD (Moving Average Convergence Divergence)
- MACD is deeply negative but flattening.
- Potential for a momentum shift if buyers step in.
Overall Setup
- NKE is sitting on critical support with bullish divergence on RSI!
- Bounce toward $73–$75 possible if support holds!
- Breakdown below $69 could open downside toward $65!
Disclaimer
The information and publications are not meant to be, and do not constitute, financial, investment, trading, or other types of advice or recommendations supplied or endorsed by TradingView. Read more in the Terms of Use.
Disclaimer
The information and publications are not meant to be, and do not constitute, financial, investment, trading, or other types of advice or recommendations supplied or endorsed by TradingView. Read more in the Terms of Use.