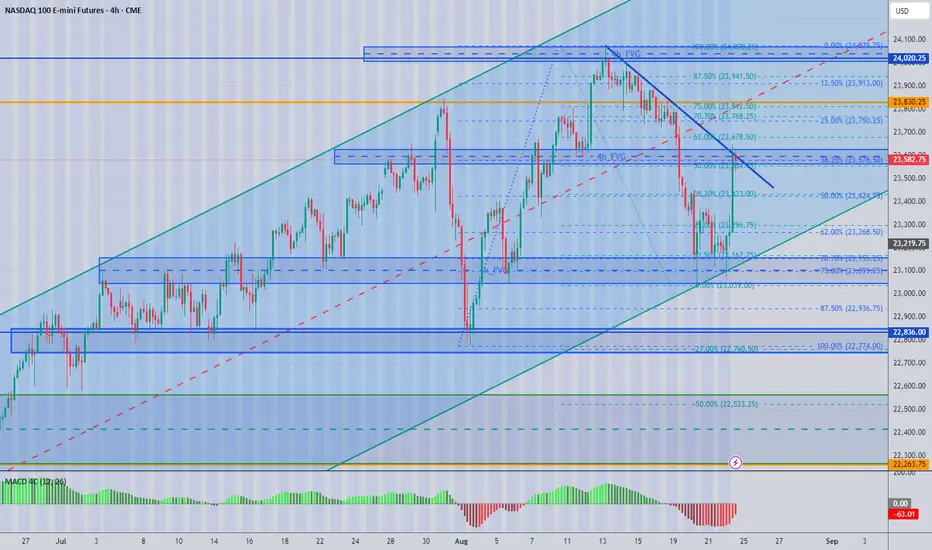
What is the standout feature of this chart I have extended the boxes to show you how areas of support and resistance interact in the market place.
The 4 hour chart is a great chart for evaluating positions.
1. Use this at setting bias and levels for breaks.
2. Then you can drill down into lower timeframe charts to identify potential position entries.
3. I would repeat the process of mapping out these lower time frame charts to identify entry levels
4. When you in your trading time frame, i use 1, 2, and 5 minute time frames, others use range bars or renko etc , these are allow personal preferences but the mapping process will remain the same.
5. I always use MACD to analyse strength of move and look for divergence.
6.I always measure an impulse higher or lower with the Fibonacci retracement tool. This will show you retracement values and set target levels.
7. I love the two moving averages 144 and 169 period.
8. Candle patterns help in determining market structure and order flow if you know what to look for.
I hope this all helps you any questions i am happy to answer them
good luck
Mark
Mark Langley
Disclaimer
The information and publications are not meant to be, and do not constitute, financial, investment, trading, or other types of advice or recommendations supplied or endorsed by TradingView. Read more in the Terms of Use.
Mark Langley
Disclaimer
The information and publications are not meant to be, and do not constitute, financial, investment, trading, or other types of advice or recommendations supplied or endorsed by TradingView. Read more in the Terms of Use.