Technical Overview
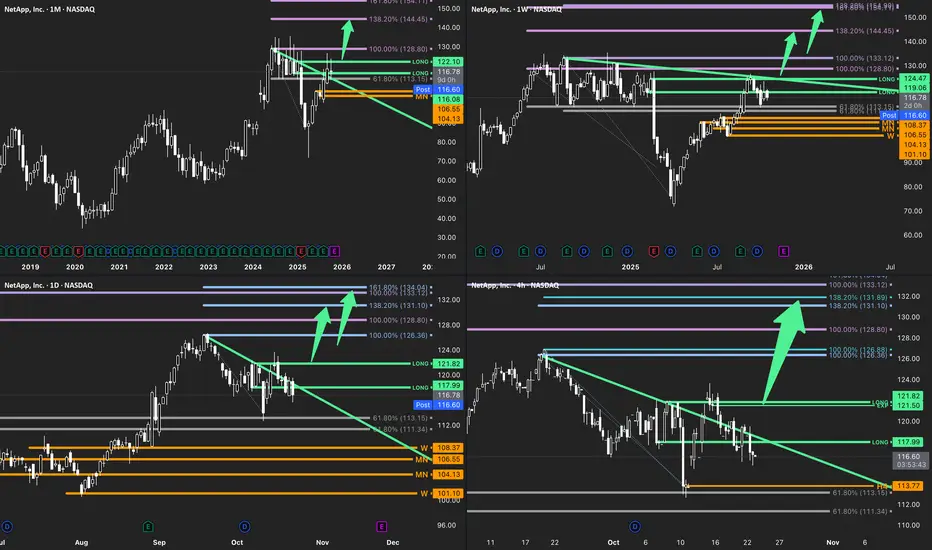
Monthly: Structure confirms a breakout from the corrective base, reclaiming the 61.8% Fib zone and pivot near 116.80. Expansion phase resuming toward upper Fibonacci targets at 128.80 → 138.20%.
Weekly: Price consolidates above the breakout line, holding structure alignment with MN support. The next weekly impulsive move could target the 133–145 resistance cluster.
Daily: Downtrend line broken with follow-through. The D1 wave rhythm now favors continuation as long as 116.60 holds.
H4: Compression wedge resolved upward; local trigger confirmed above 117.99–121.50 zone. Near-term expansion path projects into 128.80 → 133.00 → 138.20%.
Market Phase: Expansion
⸻
Trade Structure & Key Levels
Bias: Long above 116.60
Trigger: H4 higher-low and close above 121.50
Invalidation: H4 close below 113.77
Path: D1 100–138% → W 161.8% zone near 133–145
ATR(14D): 3.9 | Vol(20D): 5.8 M
⸻
Risk & Event Context
Earnings cycle completed; volatility has normalized. Broader tech sector rotation remains supportive, though NASDAQ structure may introduce short-term resistance near index highs.
⸻
Conclusion
NetApp’s structure aligns across all timeframes, confirming a transition from correction to expansion. Sustained closes above 121.50 validate the bullish path toward 133.00–138.00. A close below 113.77 would neutralize the current bias.
⸻
Disclaimer
This analysis is for informational purposes only and does not constitute investment advice, an offer, or a recommendation.
Market conditions and price behavior may change without notice. Past performance is not indicative of future results.
Always conduct your own research or consult a licensed financial advisor before making investment decisions.
Day trader capitalizing on the expansion phases of emerging trends.
MORE CHARTS & FREE EDUCATION
SUBSCRIBE 🚀 themarketflow.trading
MORE CHARTS & FREE EDUCATION
SUBSCRIBE 🚀 themarketflow.trading
Disclaimer
The information and publications are not meant to be, and do not constitute, financial, investment, trading, or other types of advice or recommendations supplied or endorsed by TradingView. Read more in the Terms of Use.