NVDA Under Pressure: Sellers Dominate as Volume Spikes Fail to Sustain Price Gains
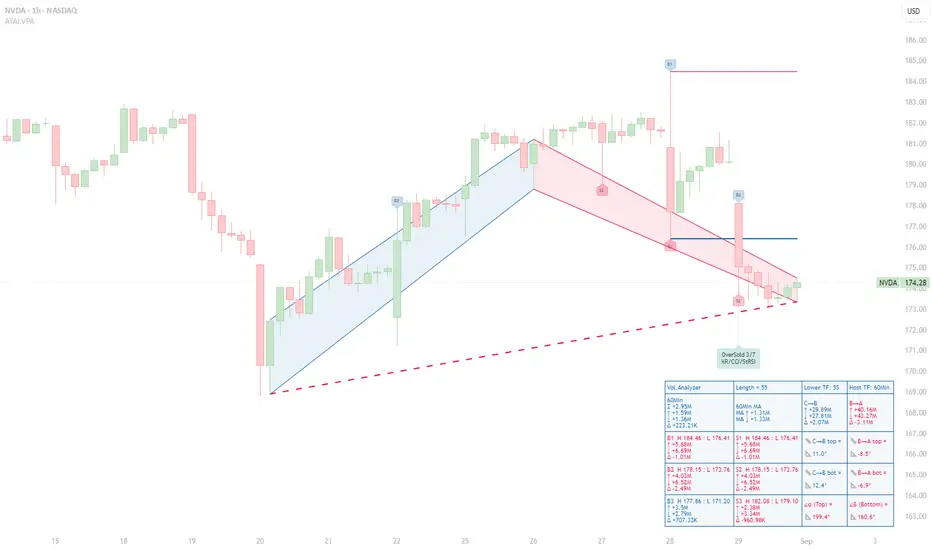
Context – This 60‑minute NVDA chart uses the ATAI Volume Pressure Analyzer (VPA) on a 55‑bar window. The indicator plots an A→B→C structure: the blue C→B segment tracks the preceding advance and the red B→A segment the subsequent pull‑back. Up‑volume and down‑volume are calculated on a lower time frame and then aggregated into host‑time‑frame bars to expose buying and selling pressure.
Volume ranking – Within this window the indicator labels the three largest buying and selling bars (B1–B3 and S1–S3) and reports their statistics in a HUD. The most prominent bar, B1, spans H 184.46 to L 176.41 and shows 5.68 M up‑volume versus 6.69 M down‑volume, producing a –1.01 M delta. B2 (H 178.15–L 173.76) is even more bearish, with 4.03 M up‑volume and 6.52 M down‑volume (delta –2.49 M). B3 (H 177.86–L 171.20) is the only buying bar with a positive delta: 3.50 M up‑volume, 2.79 M down‑volume and a +0.71 M surplus. On the sell side, S1 and S2 coincide with B1 and B2 and mirror their negative deltas. S3 (H 182.08–L 179.10) registers 2.38 M up‑volume against 3.34 M down‑volume for a –0.96 M delta. Collectively, the pattern shows that peaks in buying volume have not yielded higher closes; sellers control all but one of the ranked bars.
Segment behaviour – The C→B rally accumulated roughly 29.89 M up‑volume versus 27.81 M down‑volume, a modest +2.07 M delta. In contrast, the B→A decline logged 40.16 M up‑volume against 43.27 M down‑volume, giving a –3.11 M deficit. The slopes of the trend lines accentuate the story: the advance has gentle positive slopes (~+11° top, +12.4° bottom), whereas the pull‑back slopes downward (–8.5° and –6.9°). Sellers have pushed prices lower more decisively than buyers previously drove them higher.
Price structure and implications – Price currently trades around 174.28 USD. Resistance sits near 178.15 (B2/S2) and 184.46 (B1/S1). As long as price remains beneath these pivot highs and subsequent B‑ranked bars fail to show a positive delta, the selling bias persists. The red dashed guide, connecting recent lows, continues to slope downward, confirming the bearish tilt. Only a flattening or reversal of this guide—coupled with a new B‑ranked bar sporting a positive delta—would hint at a shift in momentum.
Risk management – This analysis is intended for educational purposes. It illustrates how separating up‑ and down‑volume on lower time frames can reveal hidden pressures in intraday charts. It is not a recommendation to buy or sell NVDA stock. Always consult your own trading plan and risk tolerance before acting.
Related publications
Disclaimer
The information and publications are not meant to be, and do not constitute, financial, investment, trading, or other types of advice or recommendations supplied or endorsed by TradingView. Read more in the Terms of Use.
Related publications
Disclaimer
The information and publications are not meant to be, and do not constitute, financial, investment, trading, or other types of advice or recommendations supplied or endorsed by TradingView. Read more in the Terms of Use.