I’m new to trading and still learning how to properly read market structure, trends, and support/resistance. This post is for feedback only, not a trade idea.
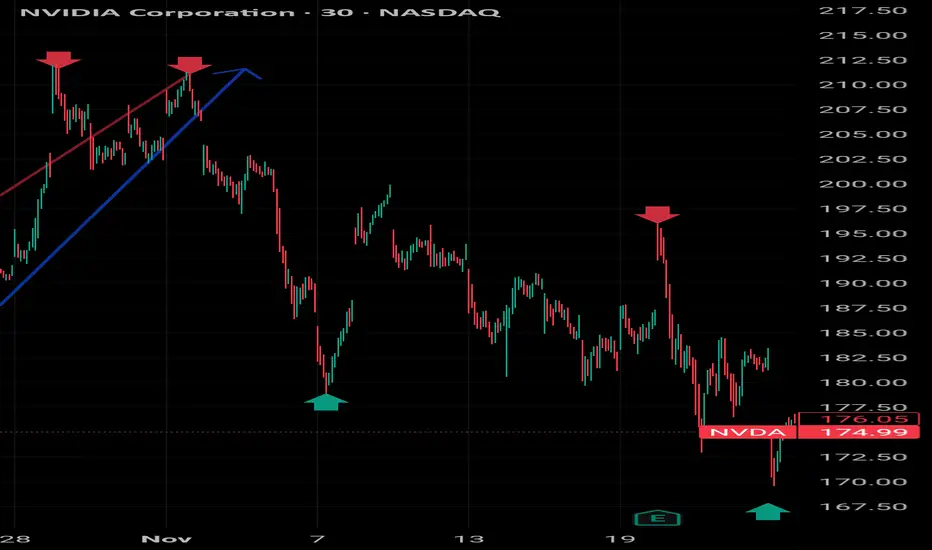
On this 30-minute NVDA chart, I marked:
Higher highs / higher lows during the uptrend (blue arrows)
Lower highs where price rejected and rolled over (red arrows)
Pullbacks and breakdown moves after resistance failed (yellow arrows)
Key reaction lows that appeared to act as temporary support (green arrows)
What I’m trying to understand:
Are my trend lines and structure shifts being identified correctly?
Do these rejection points actually qualify as resistance, or am I over-drawing?
Where would experienced traders simplify this chart?
At what point does structure clearly break instead of “just pulling back”?
No position taken.
No entries, targets, or stops planned.
Strictly working on reading price behavior and cleaning up my levels.
Looking for constructive feedback on:
Line placement
Market structure interpretation
Common beginner mistakes you see here
Appreciate the insight.
Disclaimer
The information and publications are not meant to be, and do not constitute, financial, investment, trading, or other types of advice or recommendations supplied or endorsed by TradingView. Read more in the Terms of Use.
Disclaimer
The information and publications are not meant to be, and do not constitute, financial, investment, trading, or other types of advice or recommendations supplied or endorsed by TradingView. Read more in the Terms of Use.