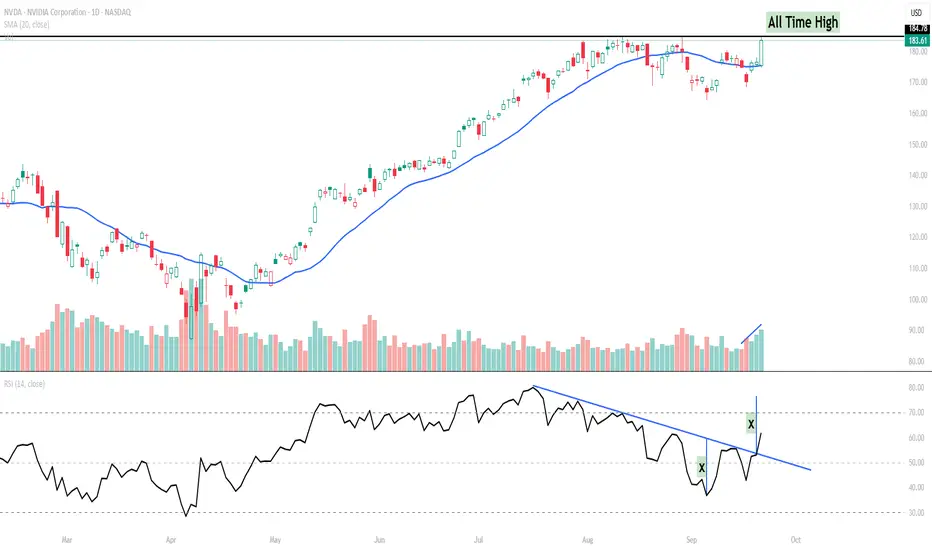
NVIDIA has staged a sharp move higher, reclaiming momentum after weeks of sideways-to-lower action. What makes this setup notable is not just the price, but the RSI trendline breakout.
Key Points:
RSI Trendline Breakout: The RSI broke above a descending trendline, suggesting momentum is shifting back in favour of buyers.
Volume Confirmation: The breakout coincided with a strong volume spike – often an early tell that institutions are stepping in.
Price Action: Price is now retesting the all-time high zone (~$184–185). A sustained close above this level could open the door for further upside.
Short-Term View: As long as NVDA holds above the $175–177 support zone, the bias remains bullish with potential for acceleration if RSI pushes toward the overbought zone.
Watchlist Levels:
Upside breakout trigger: $185+ (new all-time high)
Immediate support: $175
Momentum invalidation: Below $175
This is a classic case of how RSI trendline analysis can provide an early signal, often before price fully confirms the breakout.
Sharing indicator studies & global setups | twitter.com/gautam_icma
Disclaimer
The information and publications are not meant to be, and do not constitute, financial, investment, trading, or other types of advice or recommendations supplied or endorsed by TradingView. Read more in the Terms of Use.
Sharing indicator studies & global setups | twitter.com/gautam_icma
Disclaimer
The information and publications are not meant to be, and do not constitute, financial, investment, trading, or other types of advice or recommendations supplied or endorsed by TradingView. Read more in the Terms of Use.