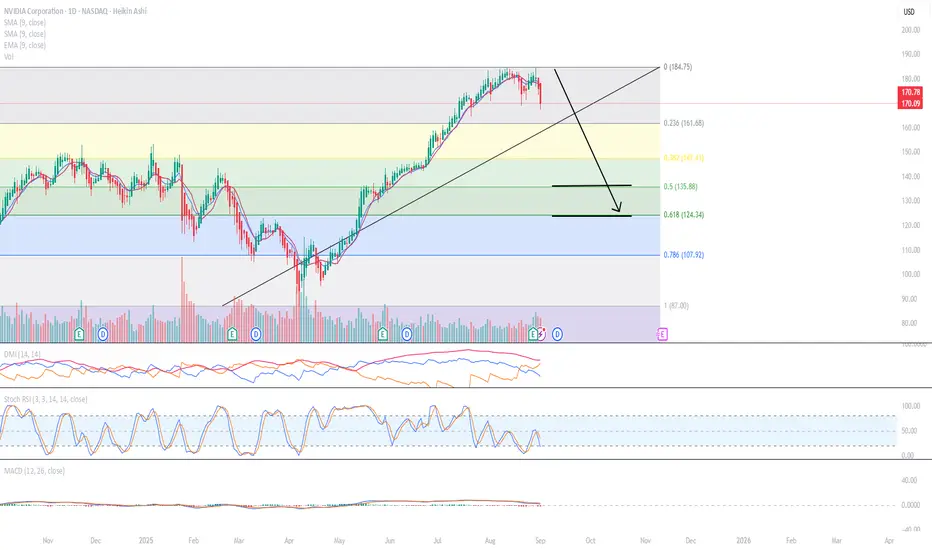
NVDA is continuing downward. I have the target as being around middle of October or later.
I used the Heikin Ashi candles:
1: They show more of a directional movement.
2: They tend to filter out the market noise, so you can see the direction better.
3: it reduces false signals, allowing you to stay in the trade longer.
4: And it also gives a smoother appearance making it easier to see the trends and reversals.
My stops are:
1) the high of the previous Heikin Ashi candlestick,
2) 2 green Heikin Ashi candlesticks,
3) a specific dollar amount for a total loss for my trade or
4) a specific dollar amount per contract.
If it hits one of those stops, I am out of my trade.
Typically, I would wait until there are 2 red daily Heikin Ashi candlesticks before entering which it has shown as of today.
I use the MacD, the Stock RSI and the DMI to assist me with the direction of the market. I am not perfect at them.
I personally find:
* the 5 minute indicators typically represents what will happen in the next half and hour.
* the 10 minute indicators typically represents what will happen in the next hour.
* the 30 minute indicators typically represents what will happen in the daily.
* and, the hour indicators typically represents what will happen in the next week.
If you look at the weekly indicators, they are bearish already which shows a longer term directional movement.
Trade at your own risk, make sure you have stops in place and only use 10% of your trading account, so that if you are wrong, you will not blow up your account.
Happy trading!
Disclaimer
The information and publications are not meant to be, and do not constitute, financial, investment, trading, or other types of advice or recommendations supplied or endorsed by TradingView. Read more in the Terms of Use.
Disclaimer
The information and publications are not meant to be, and do not constitute, financial, investment, trading, or other types of advice or recommendations supplied or endorsed by TradingView. Read more in the Terms of Use.