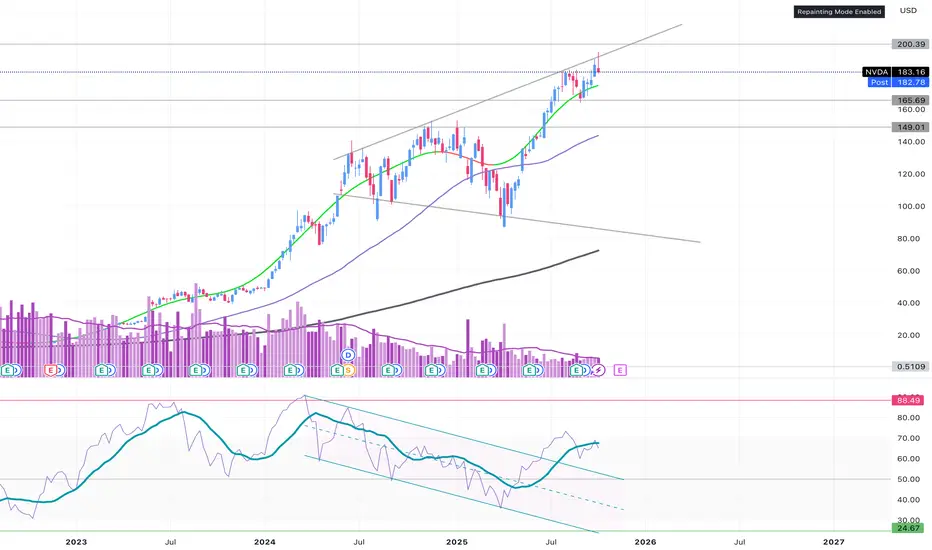
MOMENTUM - daily is in uptrend channel; weekly is ??; monthly looks toppy
VOLUME - some increased volume on the breakout above 183; Overall, volume not significantly changed since the April bottom
PRICE - There is a topping candle on the weekly at the upper trendline of the megaphone; Price reached 195 before reversing back down
What does it all mean?
1. Possible revisit 165
2. Possible revisit 150
3. Possible retouch of 180 and then next move up again
3. Long-term top is in with uncertain future
Let me know what you think….
Disclaimer
The information and publications are not meant to be, and do not constitute, financial, investment, trading, or other types of advice or recommendations supplied or endorsed by TradingView. Read more in the Terms of Use.
Disclaimer
The information and publications are not meant to be, and do not constitute, financial, investment, trading, or other types of advice or recommendations supplied or endorsed by TradingView. Read more in the Terms of Use.