How to Use Candlesticks in a High-Probability Way | Tutorial #4
Candlesticks + Support & Resistance in a Downtrend (Context Matters)
In this part, we move beyond isolated candlesticks and place them into real market context.
This tutorial focuses on combining candlesticks with Support & Resistance within a downtrend, which is where high-probability setups are actually formed.
⚠️ Important note:
This part is slightly more advanced than the previous three tutorials.
If something on the chart is unclear, feel free to ask in the comments — I’ll do my best to answer everyone.
Don’t worry if it feels complex at first.
We are just scratching the surface — from here, the real trading logic begins.
Strongly recommended:
Review Tutorials #1–#3 first.
Each part builds on the previous one, and this structure will continue throughout the series.
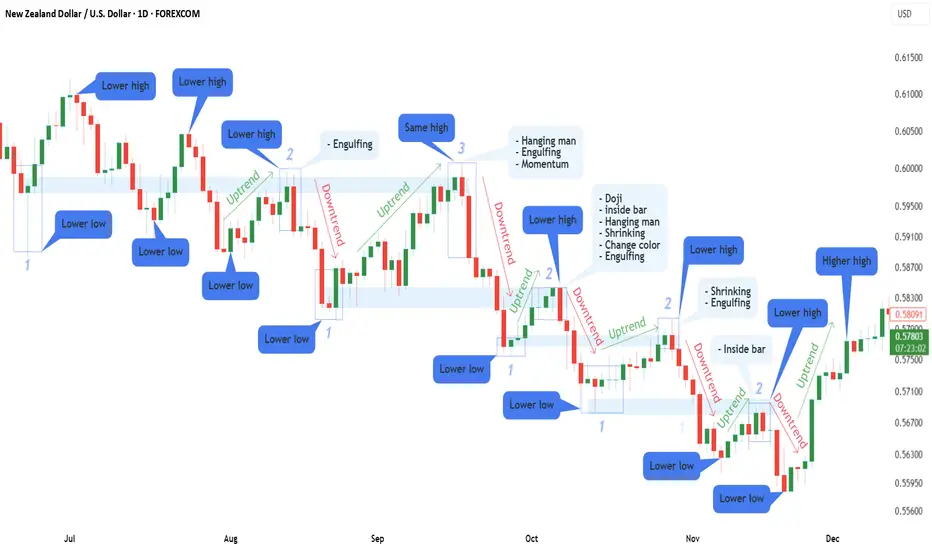
📌 Chart Explanation (NZDUSD Example)
I’m using NZDUSD again, the same pair from Part 1, to keep everything consistent and easier to follow.
On the chart, you can see:
1️⃣ Candlesticks
→ They show price reactions when reversals or rejections occur.
2️⃣ Support & Resistance Zones
→ Key areas where price previously reacted.
3️⃣ Numbers (1–3)
→ Represent multiple touches of support and resistance, increasing their importance.
4️⃣ Market Structure
→ Lower Highs + Lower Lows = Downtrend context
5️⃣ Directional Arrows
→ Visual guidance for trend direction and corrections.
🧠 Why Context Changes Everything
Up to now, we worked mainly with candlesticks and trend direction.
Now we add the most important missing piece for high-probability trading:
👉 Support & Resistance
Candlesticks do not create signals on their own.
They become powerful only when they appear at the right location within market structure.
(If Support & Resistance is not fully clear yet, I’ve already published Part 1 of that tutorial — feel free to ask in the comments, and I’ll gladly make Part 2.)
📈 Finding Trade Opportunities — Step by Step
(Using all 4 tutorials together)
1️⃣ Identify a downtrend
→ Lower highs & lower lows
2️⃣ Draw Support & Resistance zones
3️⃣ Wait for candlestick stacking
→ As explained in previous tutorials (clusters, sequences, pressure buildup)
🔥 Bonus Confirmation
If, after candlesticks stack together, you see:
This is where probability increases, not because of one candle — but because everything aligns.
🛡 Risk Management Reminder
🧠 Continuing the Series
⚠️ DISCLAIMER
This content is for educational purposes only and does not constitute financial advice.
Trading involves risk — always conduct your own analysis.
I am not responsible for any decisions or losses based on this material.
In this part, we move beyond isolated candlesticks and place them into real market context.
This tutorial focuses on combining candlesticks with Support & Resistance within a downtrend, which is where high-probability setups are actually formed.
⚠️ Important note:
This part is slightly more advanced than the previous three tutorials.
If something on the chart is unclear, feel free to ask in the comments — I’ll do my best to answer everyone.
Don’t worry if it feels complex at first.
We are just scratching the surface — from here, the real trading logic begins.
Strongly recommended:
Review Tutorials #1–#3 first.
Each part builds on the previous one, and this structure will continue throughout the series.
📌 Chart Explanation (NZDUSD Example)
I’m using NZDUSD again, the same pair from Part 1, to keep everything consistent and easier to follow.
On the chart, you can see:
1️⃣ Candlesticks
→ They show price reactions when reversals or rejections occur.
2️⃣ Support & Resistance Zones
→ Key areas where price previously reacted.
3️⃣ Numbers (1–3)
→ Represent multiple touches of support and resistance, increasing their importance.
4️⃣ Market Structure
→ Lower Highs + Lower Lows = Downtrend context
5️⃣ Directional Arrows
→ Visual guidance for trend direction and corrections.
🧠 Why Context Changes Everything
Up to now, we worked mainly with candlesticks and trend direction.
Now we add the most important missing piece for high-probability trading:
👉 Support & Resistance
Candlesticks do not create signals on their own.
They become powerful only when they appear at the right location within market structure.
(If Support & Resistance is not fully clear yet, I’ve already published Part 1 of that tutorial — feel free to ask in the comments, and I’ll gladly make Part 2.)
📈 Finding Trade Opportunities — Step by Step
(Using all 4 tutorials together)
1️⃣ Identify a downtrend
→ Lower highs & lower lows
2️⃣ Draw Support & Resistance zones
3️⃣ Wait for candlestick stacking
→ As explained in previous tutorials (clusters, sequences, pressure buildup)
🔥 Bonus Confirmation
If, after candlesticks stack together, you see:
- an Engulfing candle, or
- a Momentum candle
This is where probability increases, not because of one candle — but because everything aligns.
🛡 Risk Management Reminder
- No setup is guaranteed.
- Always apply proper risk management and position sizing.
- If you’re still learning or testing these concepts, it is strongly recommended to practice on a demo account first before risking real capital.
- Trading is a process, not a shortcut to fast profits.
- Focus on consistency, discipline, and execution — not outcomes.
🧠 Continuing the Series
- If anything on the chart is unclear, feel free to ask in the comments — I’ll do my best to help.
- This tutorial is part of a structured series where each part builds on the previous one.
- Following simply helps you keep track of future lessons.
⚠️ DISCLAIMER
This content is for educational purposes only and does not constitute financial advice.
Trading involves risk — always conduct your own analysis.
I am not responsible for any decisions or losses based on this material.
Related publications
Disclaimer
The information and publications are not meant to be, and do not constitute, financial, investment, trading, or other types of advice or recommendations supplied or endorsed by TradingView. Read more in the Terms of Use.
Related publications
Disclaimer
The information and publications are not meant to be, and do not constitute, financial, investment, trading, or other types of advice or recommendations supplied or endorsed by TradingView. Read more in the Terms of Use.