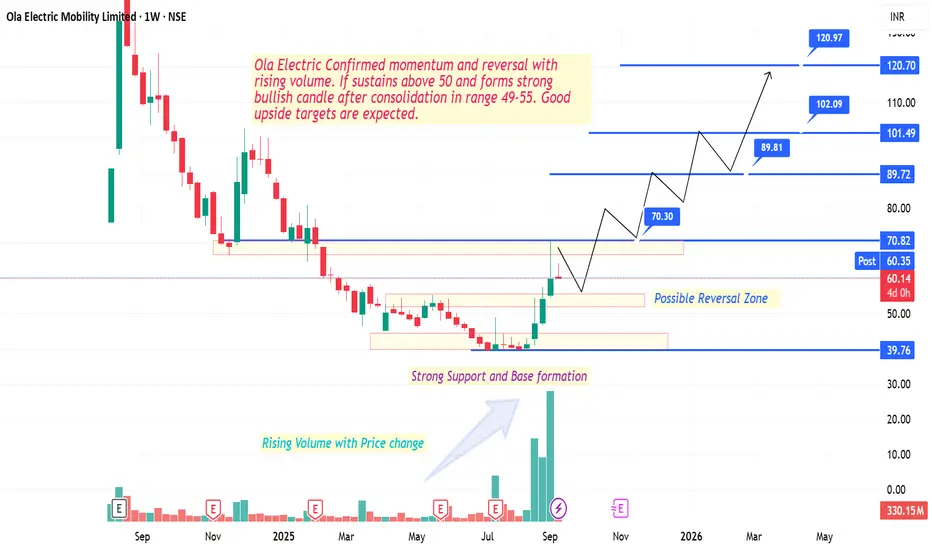
Ola Electric has shown confirmed momentum and reversal with rising volume. After a long consolidation phase between ₹49–55, the stock has broken out with strong bullish candles, supported by heavy volumes – signaling a possible trend reversal.
🔹 Key Technical Observations
✅ Strong base formation and reversal zone around ₹49–55
✅ Rising volumes confirming price momentum
✅ Sustaining above ₹50 adds bullish strength
✅ Next resistance levels:
₹70.30 / ₹70.82
₹89.72 / ₹89.81
₹101.49 / ₹102.09
₹120.70 / ₹120.97
📈 If momentum continues and price sustains above ₹60–65 levels, higher targets can be achieved step by step.
⚠️ Risk Management:
Keep strict stop loss below ₹49 zone (support base) or as per your risk management. Previous swing low is preffered for long term investors.
Partial profit booking near resistance levels is advisable.
Re-entry possible on retest of breakout zones.
#OlaElectric #NSEStocks #MomentumTrading #PriceAction #BreakoutStocks #VolumeAnalysis #StockMarketIndia #SwingTrading #ReversalSetup #TradingViewIndia
Disclaimer
The information and publications are not meant to be, and do not constitute, financial, investment, trading, or other types of advice or recommendations supplied or endorsed by TradingView. Read more in the Terms of Use.
Disclaimer
The information and publications are not meant to be, and do not constitute, financial, investment, trading, or other types of advice or recommendations supplied or endorsed by TradingView. Read more in the Terms of Use.