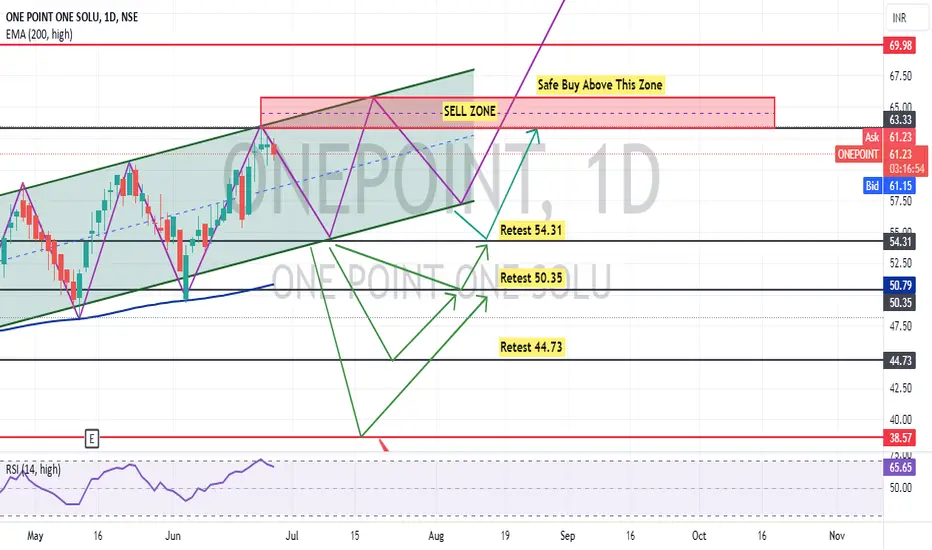
As per previous chart history and current chart pattern, ONEPOINT is making Higher Highs in one day time frame. Soon it will give a breakout either side
You can buy this stock at current market price @61.23 and make average on every dip as shown on the chart or you can wait for a dip to enter in the buy trade
This is my personal opinion and I am not suggesting anyone to buy this stock because I am NOT SEBI registered person
Thanks for your support as always
Disclaimer
The information and publications are not meant to be, and do not constitute, financial, investment, trading, or other types of advice or recommendations supplied or endorsed by TradingView. Read more in the Terms of Use.
Disclaimer
The information and publications are not meant to be, and do not constitute, financial, investment, trading, or other types of advice or recommendations supplied or endorsed by TradingView. Read more in the Terms of Use.