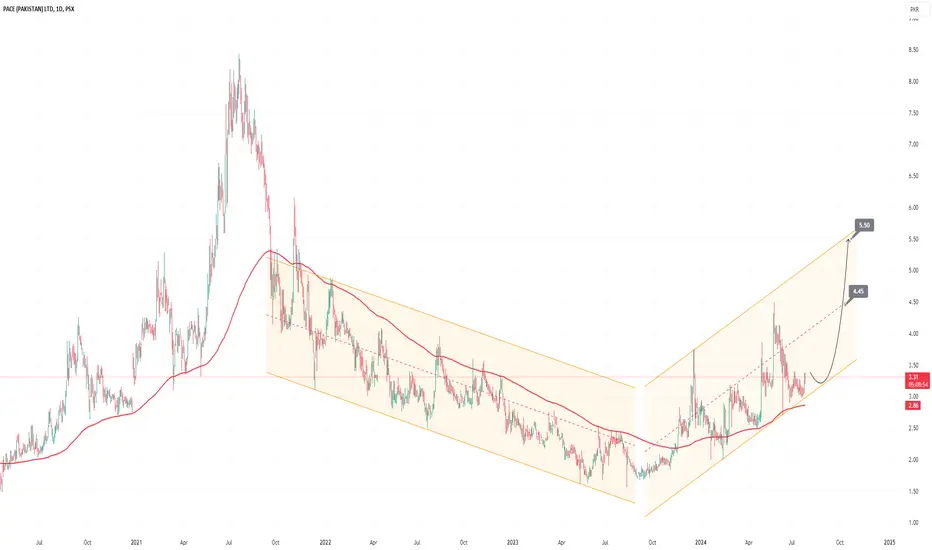
The stock is presently trading above its 200-day Exponential Moving Average (EMA), adhering to a parallel channel that signifies a bullish trend. On the daily timeframe, there is a clear formation of Higher Highs (HHs) and Higher Lows (HLs). The price has recently experienced a pullback from the support level of the parallel channel, currently hovering above this support. A retracement toward the initial resistance level of 4.45 is anticipated.
Should trading volume increase and the price break above and sustain above this resistance level, it is plausible that the price could test the upper boundary of the parallel channel, approximately 5.50. However, this bullish outlook would be invalidated if the channel breaks downward. To manage risk effectively, it is advisable to set a stop-loss order at 2.50.
Should trading volume increase and the price break above and sustain above this resistance level, it is plausible that the price could test the upper boundary of the parallel channel, approximately 5.50. However, this bullish outlook would be invalidated if the channel breaks downward. To manage risk effectively, it is advisable to set a stop-loss order at 2.50.
Note
Go Go GoTrade closed: target reached
Book 50% profit on first target 🚀🚀Trade closed: target reached
Target reachedDisclaimer
The information and publications are not meant to be, and do not constitute, financial, investment, trading, or other types of advice or recommendations supplied or endorsed by TradingView. Read more in the Terms of Use.
Disclaimer
The information and publications are not meant to be, and do not constitute, financial, investment, trading, or other types of advice or recommendations supplied or endorsed by TradingView. Read more in the Terms of Use.