PANW has staged a strong comeback from a major support zone, reclaiming its bullish channel and now knocking on the door of previous highs. With key indicators flashing early bullish signals, the stock is setting up for a potential breakout — but the overhead resistance remains a critical hurdle.
Technical Breakdown
Trend Structure
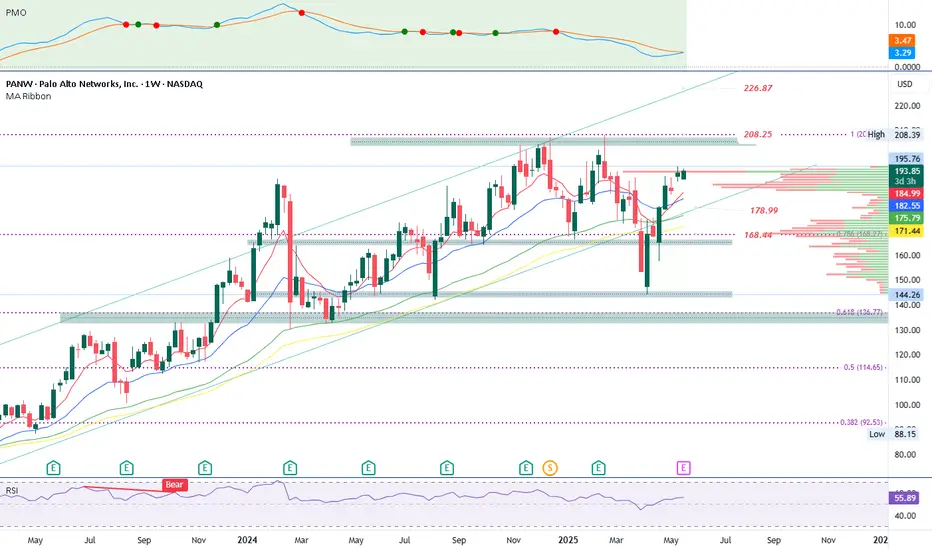
Rebounded from long-term demand zone (~$136–$145)
Back inside the ascending price channel
Testing major resistance at $208.25 (previous high)
Fibonacci Levels
0.786 retracement (support): $168.27 — respected perfectly
0.618 support zone: $136.77 — long-term base
Fib extension resistance: $226.87 — aligns with channel top
Indicators
PMO: Bullish crossover from bottom range; early upside signal
RSI: At 55.93, trending upward; plenty of room before overbought
Bullish Scenario
If PANW closes above $208.25 with volume:
Opens clean breakout potential to $226.87 (Fib extension & channel top)
Momentum indicators support trend continuation
Pullbacks toward $182–$185 likely to get bought aggressively
Trigger: Weekly close > $208.25
Target: $226.87
Support levels for re-entry: $185, $175, and $168
Bearish Scenario
If PANW gets rejected at $208.25:
Could form a double top and trigger a reversal
Breakdown below $175 would invalidate near-term bullish setup
Watch for retest of $168.27 (Fib + demand zone) — losing that risks flush toward $137
Trigger: Rejection at $208 + close below $175
Downside risk levels: $168 → $145 → $137
Final Thoughts
The weekly structure leans bullish — but the next $10 range is a battlefield. If buyers clear $208, there’s room to run. Until then, manage risk and watch for decisive confirmation before committing full capital.
Disclaimer
The information and publications are not meant to be, and do not constitute, financial, investment, trading, or other types of advice or recommendations supplied or endorsed by TradingView. Read more in the Terms of Use.
Disclaimer
The information and publications are not meant to be, and do not constitute, financial, investment, trading, or other types of advice or recommendations supplied or endorsed by TradingView. Read more in the Terms of Use.