PATH - CURRENT PRICE : 17.42
UiPATH (PATH) – Previous Targets Achieved, Buy-on-Dips Setup After Healthy Pullback
The previous technical buy call on UiPATH has successfully achieved all stated upside targets (refer to the earlier analysis via the shared link for reading context). Following this strong rally, the stock has now entered a pullback phase, which is technically expected after an extended upside move.
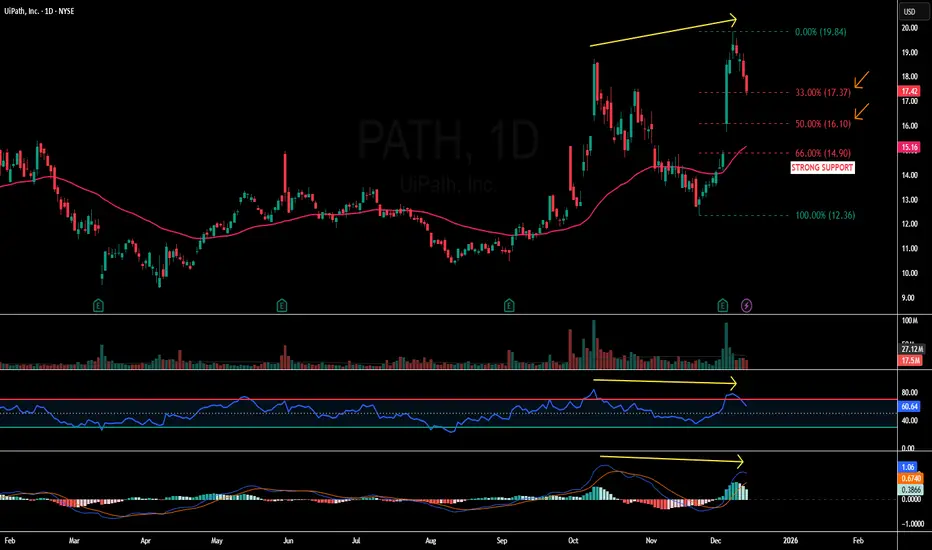
The current retracement is accompanied by a bearish divergence between price and momentum indicators (RSI & MACD), as highlighted by the yellow arrows on the chart. Bearish divergence occurs when price makes a higher high while momentum indicators fail to confirm with higher highs, often signaling short-term exhaustion and a corrective move rather than a trend reversal. This explains the ongoing pullback and supports the view that the decline is corrective in nature.
From a structural perspective, the pullback remains constructive and healthy. Price has retraced approximately 33% of the prior advance, which aligns well with Dow Theory, where strong trends commonly retrace one-third or one-half before resuming the primary trend. Importantly, price continues to trade above the 50-day EMA, while both RSI and MACD remain in bullish territory, indicating that the broader bullish momentum is still intact despite near-term consolidation.
A critical level to watch is 14.90, which serves as STRONG SUPPORT. This level represents a two-thirds (≈66%) retracement under Dow Theory, coincides with a previous gap-up demand zone, and is located near the rising 50-day EMA, creating a strong confluence of technical support.
Trading Plan (Buy-on-Dips Approach):
UiPATH (PATH) – Previous Targets Achieved, Buy-on-Dips Setup After Healthy Pullback
The previous technical buy call on UiPATH has successfully achieved all stated upside targets (refer to the earlier analysis via the shared link for reading context). Following this strong rally, the stock has now entered a pullback phase, which is technically expected after an extended upside move.
The current retracement is accompanied by a bearish divergence between price and momentum indicators (RSI & MACD), as highlighted by the yellow arrows on the chart. Bearish divergence occurs when price makes a higher high while momentum indicators fail to confirm with higher highs, often signaling short-term exhaustion and a corrective move rather than a trend reversal. This explains the ongoing pullback and supports the view that the decline is corrective in nature.
From a structural perspective, the pullback remains constructive and healthy. Price has retraced approximately 33% of the prior advance, which aligns well with Dow Theory, where strong trends commonly retrace one-third or one-half before resuming the primary trend. Importantly, price continues to trade above the 50-day EMA, while both RSI and MACD remain in bullish territory, indicating that the broader bullish momentum is still intact despite near-term consolidation.
A critical level to watch is 14.90, which serves as STRONG SUPPORT. This level represents a two-thirds (≈66%) retracement under Dow Theory, coincides with a previous gap-up demand zone, and is located near the rising 50-day EMA, creating a strong confluence of technical support.
Trading Plan (Buy-on-Dips Approach):
- At current levels, traders may consider initiating HALF of the intended position.
- If price retraces further toward the 50% retracement level, the remaining half position may be added, as this remains a healthy pullback within an uptrend.
- A decisive break below 14.90 (66% level) would invalidate the setup and should be treated as a cut-loss level.
As long as price holds above this support zone, the pullback can be viewed as a buy-the-dip opportunity, with the potential for the primary uptrend to resume.
FIRST TARGET : 18.50
SECOND TARGET : 19.80
SUPPORT : 14.90
Related publications
Disclaimer
The information and publications are not meant to be, and do not constitute, financial, investment, trading, or other types of advice or recommendations supplied or endorsed by TradingView. Read more in the Terms of Use.
Related publications
Disclaimer
The information and publications are not meant to be, and do not constitute, financial, investment, trading, or other types of advice or recommendations supplied or endorsed by TradingView. Read more in the Terms of Use.