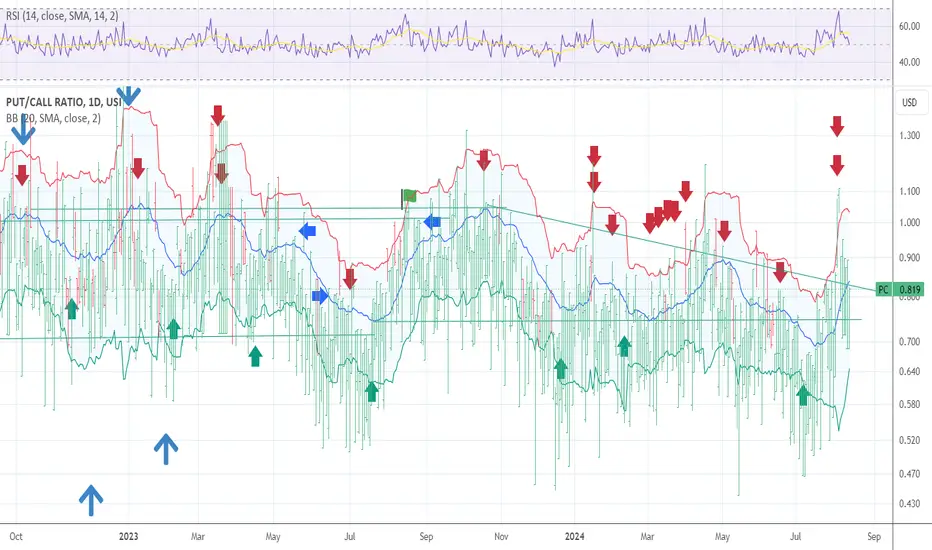
The chart posted is my 20 day put/call . We have now reach a .50 % of the drop in QQQ and we have broke above .618 and 50 % of the drop in the sp 500 cash . We are alos forming clean 5 waves up patterns based on this chart in the put /call alone I must view the correction as OVER I had saw a chance to drop into 8/12 but the structure has turned up . Once we break above todays high n on a closing basis I will look for the min of a .786 to re think . Wavetimer
Disclaimer
The information and publications are not meant to be, and do not constitute, financial, investment, trading, or other types of advice or recommendations supplied or endorsed by TradingView. Read more in the Terms of Use.
Disclaimer
The information and publications are not meant to be, and do not constitute, financial, investment, trading, or other types of advice or recommendations supplied or endorsed by TradingView. Read more in the Terms of Use.