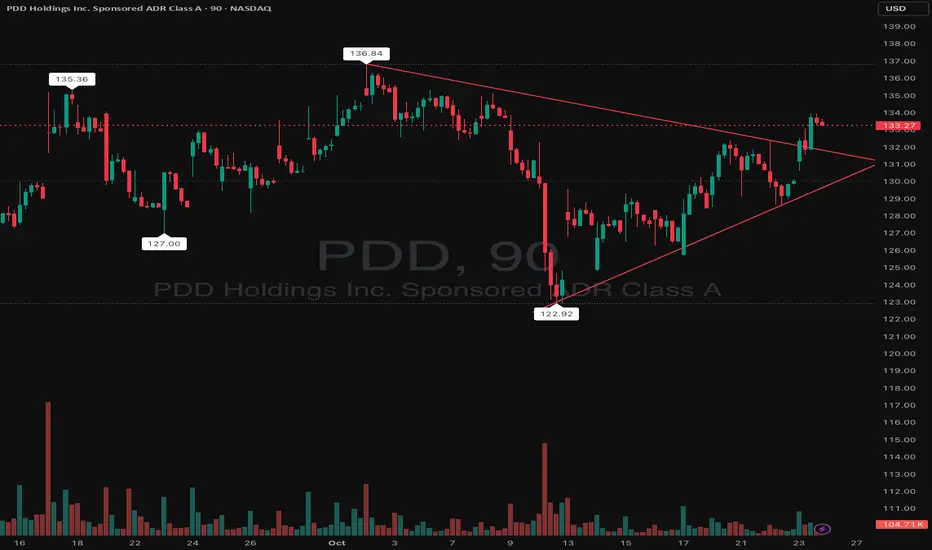
PDD Holdings (PDD) is trading within a symmetrical triangle pattern on the 90-minute chart, showing consolidation after recent volatility. The stock has been forming higher lows from $122.92 and lower highs from $136.84, tightening into a decision zone.
Price is currently around $133.27, sitting right at the upper trendline — signaling a potential breakout attempt. However, confirmation requires a clean move above $134.50–$135 with rising volume.
If buyers take control, the measured breakout target points toward $140–$142. Conversely, failure to hold $130 support may lead to a retest of $127 or the $122.90 swing low.
Support & Resistance Levels:
Support: $131.00 → $128.00 → $122.90
Resistance: $134.50 → $136.80 → $140.00
Strike Play Idea (Options/Directional):
Bullish Play:
Entry: Above $135.00 confirmation
Target: $140–$142
Stop: Below $131
Options Idea: $140 Call (2–3 weeks out) if breakout holds above $135
Disclaimer
The information and publications are not meant to be, and do not constitute, financial, investment, trading, or other types of advice or recommendations supplied or endorsed by TradingView. Read more in the Terms of Use.
Disclaimer
The information and publications are not meant to be, and do not constitute, financial, investment, trading, or other types of advice or recommendations supplied or endorsed by TradingView. Read more in the Terms of Use.