### Market Structure & Context
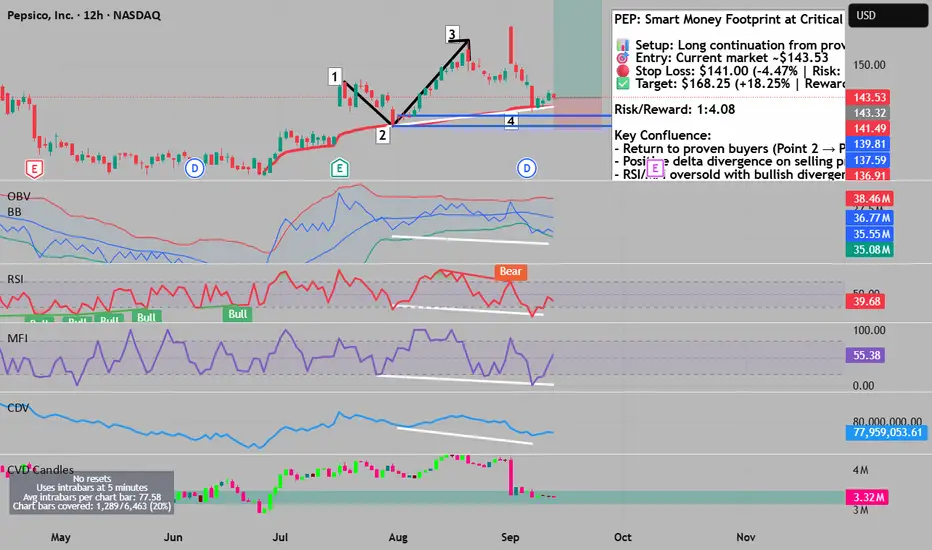
PepsiCo has demonstrated a robust uptrend architecture spanning May through September, establishing a clear sequence of higher highs and higher lows. The current retracement presents a textbook opportunity as price revisits a proven demand zone where institutional buyers previously stepped in with conviction.
The numbered wave structure reveals critical market psychology:
- Point 1 → 3: Breakout confirmation with close above initial resistance
- Point 2: Established as verified institutional accumulation zone
- Point 3 → 4: Natural retracement returning to test proven buyers
### Volume Footprint Intelligence
The granular footprint analysis exposes sophisticated accumulation patterns invisible on traditional charts:
Monday Sept 8: Despite aggressive selling with multiple imbalances, price rejected and closed above a buying imbalance zone. The positive delta on a bearish bar signals hidden institutional absorption of retail selling.
Tuesday Sept 9: Three stacked bullish imbalances formed while price pushed lower—classic absorption pattern. Negative delta divergence confirms smart money accumulating into weakness.
Wednesday Sept 10: Clean bullish close above imbalance with supporting positive delta—accumulation phase transitioning to markup.
Thursday Sept 11: Price conquered the value area high/low of previous three sessions with dual bullish imbalances and positive delta confirmation.
### Multi-Timeframe Oscillator Divergences
The technical mosaic presents compelling bullish divergences across multiple indicators:
- RSI & MFI: Both oscillators display oversold conditions at Point 4 while price forms a higher high versus Point 2—textbook positive divergence
- OBV: Piercing the lower Bollinger Band deviation signals exhausted selling pressure
- CDV: Price returned to pre-discovery consolidation zone—historically a high-probability reversal area
### Anchored VWAP Confluence
The anchored VWAP from the momentum initiation point provides dynamic support precisely at Points 2 and 4, confirming this level as algorithmically significant for institutional participants.
### Risk Management Framework
Entry Zone: $143.53 (current market price)
Stop Loss: $141.00 (-4.47% from entry | Risk: $750 per contract)
Take Profit: $168.25 (+18.25% from entry | Reward: $2,616 per contract)
Risk/Reward Ratio: 1:4.08 — exceptional asymmetric opportunity
Position Sizing: With a 4.08:1 reward-to-risk ratio, this setup offers substantial upside with controlled downside. Size position according to account risk tolerance (1-2% max risk recommended).
### Trade Execution Strategy
Entry Tactics:
- Primary entry at current levels ~$143.53
- Scale-in opportunity on any dip toward $142.50
- Confirmation entry on break above $144.50
Exit Strategy:
- Initial Target: $150.00 (psychological level) — consider taking 25% profits
- Secondary Target: $157.00 (halfway point) — reduce another 25%
- Final Target: $168.25 — exit remaining position or trail stop for continuation
Stop Management:
- Initial stop at $141.00 (below Point 2 support)
- Trail to breakeven once price reaches $150.00
- Trail to $145.00 when price hits $157.00
### Probability Assessment
This setup combines multiple high-conviction factors:
✅ Trend alignment (5-month uptrend intact)
✅ Volume structure confirmation (positive delta divergences)
✅ Technical indicator confluence (4+ bullish signals)
✅ Institutional footprint patterns (absorption visible)
✅ Risk/reward extremely favorable (1:4.08)
✅ Stop placed below critical support structure
The convergence of footprint intelligence, traditional technical analysis, and exceptional risk/reward creates an institutional-grade opportunity. The 4.08:1 reward-to-risk ratio means even with a 25% win rate, this strategy remains profitable long-term.
⚠️ Disclaimer: This analysis represents technical observations only. Always conduct your own due diligence and manage position size according to your risk tolerance.
for trading mentorship and community, message me on telegram : jacesabr_real
Disclaimer
The information and publications are not meant to be, and do not constitute, financial, investment, trading, or other types of advice or recommendations supplied or endorsed by TradingView. Read more in the Terms of Use.