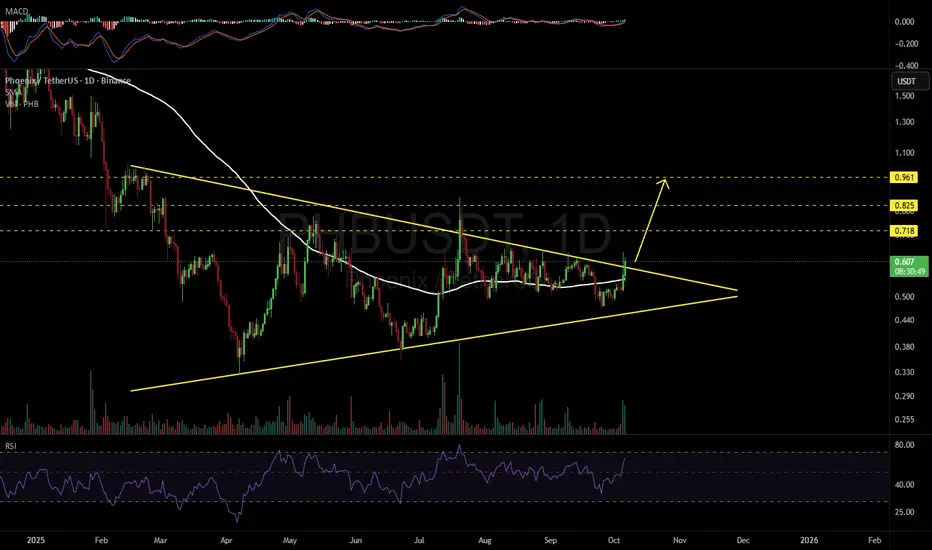
#PHB has broken above the symmetrical triangle resistance and the SMA100 on the daily chart. The increasing volume is a positive sign. If it manages to close the daily candle above the triangle, the potential targets are:
🎯 $0.718
🎯 $0.825
🎯 $0.961
⚠️ Always remember to use a tight stop-loss and maintain proper risk management.
🎯 $0.718
🎯 $0.825
🎯 $0.961
⚠️ Always remember to use a tight stop-loss and maintain proper risk management.
Disclaimer
The information and publications are not meant to be, and do not constitute, financial, investment, trading, or other types of advice or recommendations supplied or endorsed by TradingView. Read more in the Terms of Use.
Disclaimer
The information and publications are not meant to be, and do not constitute, financial, investment, trading, or other types of advice or recommendations supplied or endorsed by TradingView. Read more in the Terms of Use.