1️⃣ Trend & Structure
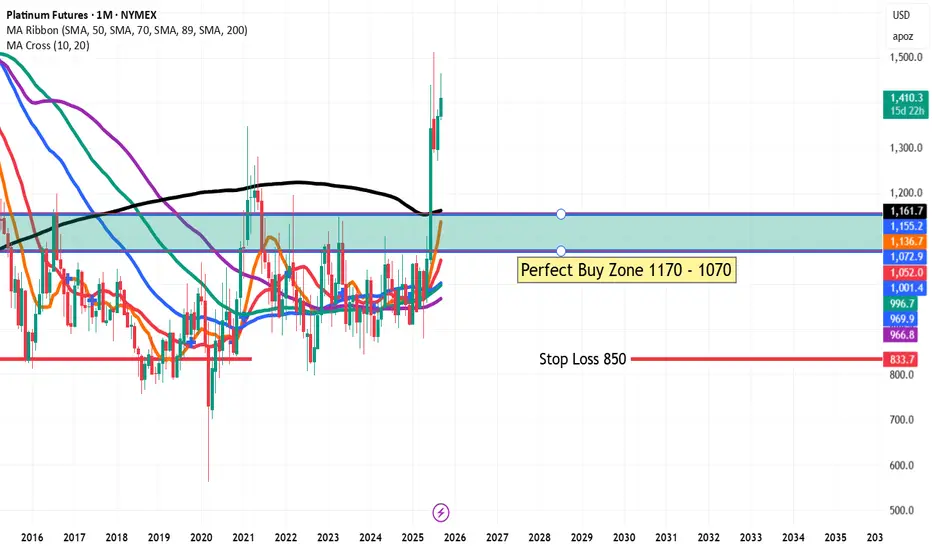
Long-Term Breakout: After years of sideways consolidation between roughly $850–$1,200, Platinum has broken above the long-term moving averages (MA ribbon and 200-month black MA), signaling a strong structural breakout.
Momentum Shift: The recent monthly candles show strong bullish follow-through, indicating renewed institutional interest.
2️⃣ Key Price Zones
Perfect Buy Zone: $1,170 – $1,070
Highlighted in yellow, this area represents a strong historical demand/support zone and an ideal pullback entry for swing or position traders.
First Target: $1,643 – $1,692
Marked in purple, this is the next major resistance cluster where price may encounter selling pressure or consolidate.
3️⃣ Support & Stop Loss
Primary Support: The breakout area around $1,150 – $1,170 now acts as the first layer of support.
Defensive Stop: The chart suggests a wider stop loss around $850, which is below the long-term base and protects against a full breakdown of the bullish setup.
4️⃣ Moving Averages & Indicators
MA Ribbon Alignment: Short- to mid-term moving averages (20, 50, 70, 89) have turned upward and are stacking bullishly above the 200-month MA, which is a classic long-term buy signal.
Volume (not shown): Sustained volume on the breakout would further confirm institutional buying.
5️⃣ Trading Scenarios
Bullish Base Case:
A pullback toward $1,170 – $1,070 offers a favorable risk–reward entry for a run toward $1,643 – $1,692.
A monthly close above $1,700 would open the door for extended gains toward the psychological $1,900–$2,000 zone.
Bearish Risk:
A decisive close below $1,070 would weaken the breakout thesis.
A drop below $850 invalidates the bullish structure entirely.
📊 Summary
Platinum Futures have shifted from a multi-year consolidation to a confirmed long-term bullish trend. The breakout above key moving averages strengthens the technical case for upside toward the $1,650 area, with a preferred accumulation zone on any retracement to $1,170–$1,070 and a protective stop near $850.
Trade active
achivedDisclaimer
The information and publications are not meant to be, and do not constitute, financial, investment, trading, or other types of advice or recommendations supplied or endorsed by TradingView. Read more in the Terms of Use.
Disclaimer
The information and publications are not meant to be, and do not constitute, financial, investment, trading, or other types of advice or recommendations supplied or endorsed by TradingView. Read more in the Terms of Use.