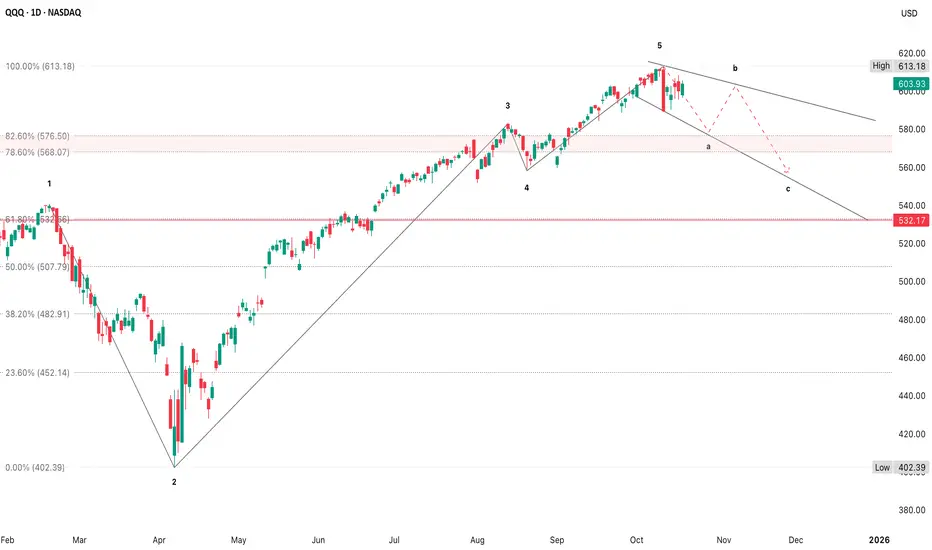
The current leg (mid-2025 onward) is the steepest recovery yet & that slope just broke
The red projection mimics the 2024 & mid-2023 patterns that featured a short distribution, decline & support at the previous breakout area
- This indicates a possible mean reversion phase rather than another leg up
- Steep advance > rounding top > 8-12% correction
- Then a multi-month basing period before recovery
- If that rhythm repeats, the current topping area around $613 could imply a pullback to $560-$580
- That would be a “standard” correction, not a crisis
The red projection mimics the 2024 & mid-2023 patterns that featured a short distribution, decline & support at the previous breakout area
- The support shelf sits near $580-$585, where prior resistance turned support (June-July 2025)
- Below $575 would confirm a more durable trend break & that’s where longer-term funds start de-risking
- Large-scale corrections on this timeframe (daily, spanning 6-12 months) usually take 2-4 weeks to play out from first break to low, followed by a 1-3 week consolidation near the floor
- So if the current roll continues, your next decisive move window is late October into early November
- If you’re trading via options, it reinforces using 2-3 week puts since they align with both the short-term structure & this macro corrective window
Trade active
The larger trend remains intact, with this being a consolidation within a primary uptrend• Wave B rally to approximately $615-$620
• Wave C decline to $560 ±10, likely finishing late November to early December
• As long as price stays below $623
I am not a licensed professional & these posts are for informational purposes only, not financial advice.
Disclaimer
The information and publications are not meant to be, and do not constitute, financial, investment, trading, or other types of advice or recommendations supplied or endorsed by TradingView. Read more in the Terms of Use.