QQQ’s consistent alignment above the 50d MA since May confirms an established primary uptrend
QQQ is testing the upper +3% boundary - a region that often acts as a momentum area in a healthy uptrend
1. Strong Uptrend, Well-Contained in Channel
2. $629-$637 Resistance Cluster
3. Structure Suggests “Bull Flag on the Daily”
4. Momentum
Bullish Continuation
Sideways Hold
Bearish Pullback
The daily and 4H trends are aligned bullishly with consolidation just below last week's highs & catalysts (FOMC, Trump–Xi & earnings) is healthy
- Each time QQQ has pulled back toward or slightly below the midline, it’s rebounded - a classic envelope rhythm
- The current setup favors rotation or sideways digestion rather than reversal, unless price breaks below $600 decisively
- QQQ is extended, so a brief pause or small pullback wouldn’t invalidate the uptrend
QQQ is testing the upper +3% boundary - a region that often acts as a momentum area in a healthy uptrend
- Sustained trading above that upper band would indicate a very strong bull phase (think “trend expansion”)
- A drift sideways or small pullback to the midline (~$610-$615) would be perfectly normal
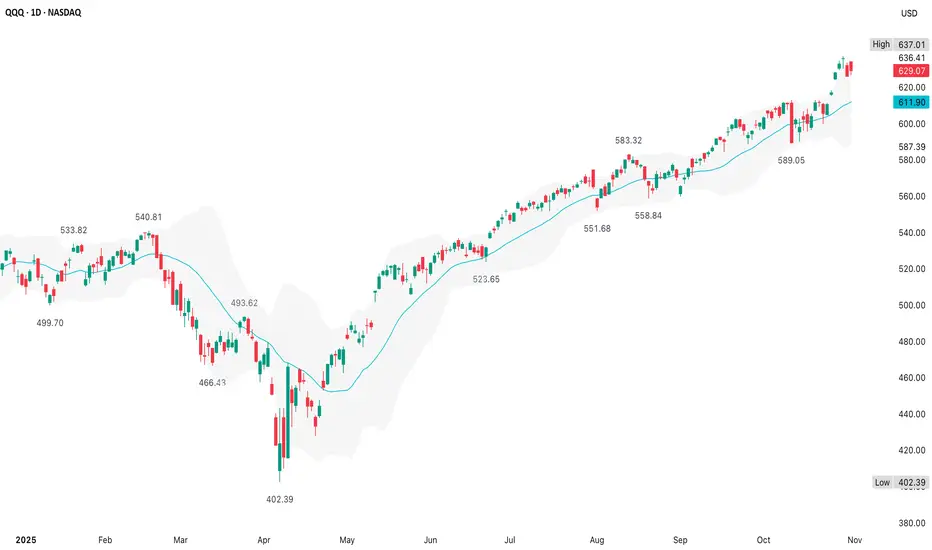
1. Strong Uptrend, Well-Contained in Channel
- The price has been trending cleanly above its midline (50d MA) since May
- The shaded envelope shows QQQ hugging the upper band, which typically signals trend strength, not exhaustion; unless, it flattens and price rolls over
2. $629-$637 Resistance Cluster
- This is a psychological round number zone & aligns with the measured handle breakout level from the 4H chart
- A few consecutive candles stalling just under the top band implies controlled profit-taking, not heavy selling
3. Structure Suggests “Bull Flag on the Daily”
- The shallow pullback around $589, $620 to $637 has flag-like proportions
- If QQQ holds above $620 into early next week & breaks $637 with volume, it would confirm a bullish continuation pattern
- $637 + ($637 – $589) ≈ $685-$690 medium-term
4. Momentum
- The trend’s slope has accelerated since early October; often, a late-stage trend characteristic, but there’s no clear topping structure
- RSI (4H chart) is near 66, meaning there’s still room before overbought extremes on the daily frame
Bullish Continuation
- Break & close >$637
- Strong QQQ/tech rally post-FOMC & Trump-Xi
- $660–$685
Sideways Hold
- $620–$637 range holds
- Consolidation before next leg
- Neutral to bullish bias
Bearish Pullback
- Daily close <$620
- Short-term correction to 50d MA (~$612)
- $600-$610 support
The daily and 4H trends are aligned bullishly with consolidation just below last week's highs & catalysts (FOMC, Trump–Xi & earnings) is healthy
- If macro tone is calm or dovish, odds favor a November breakout leg
I am not a licensed professional & these posts are for informational purposes only, not financial advice
Disclaimer
The information and publications are not meant to be, and do not constitute, financial, investment, trading, or other types of advice or recommendations supplied or endorsed by TradingView. Read more in the Terms of Use.