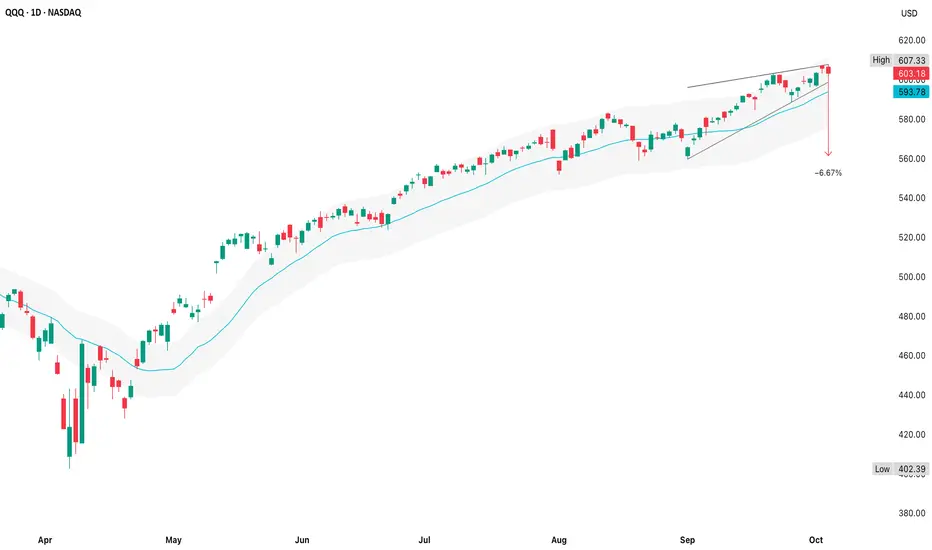
The rising wedge (marked by the two converging trendlines) is a classic loss-of-momentum pattern
A proportional, healthy pullback
- Price hit the upper boundary near $607 & closed back below $604 - a rejection right at resistance
- The measured move (-6.7%) projects down toward roughly $565–$570, aligning neatly with the lower boundary of the wedge & prior consolidation levels
- The slope of the moving average remains upward which confirms the bullish trend, but the distance between price & the mean is stretched
- Each time QQQ touched this far above the average earlier in the year (June & August), we saw 5-7% mean reversion moves
A proportional, healthy pullback
- If QQQ closes below ~$600, that would confirm the rising wedge breakdown & trigger the measured-move target to $570
- If it bounces from $595-$600, we could see a short-term fakeout before another attempt to push higher toward $615
- Volume (46.5M) on the rejection candle isn’t panic-level, but it is heavier than the previous few sessions, an early sign of distribution
I am not a licensed professional & these posts are for informational purposes only, not financial advice
Disclaimer
The information and publications are not meant to be, and do not constitute, financial, investment, trading, or other types of advice or recommendations supplied or endorsed by TradingView. Read more in the Terms of Use.