The expected-move range (using current IV ≈ 17%-18%) to see where QQQ statistically “should” trade by mid-October, which may be helpful for picking your next strike
1. Bounce from 20d MA $596–$600 with a retest of $610–$615 (60%)
2. Sideways continuation between $600–$610 (25%)
3. Close <$595 with a pullback to $580 (15 %)
A dip into $598-$600 with a stabilizing candle is statistically the highest-reward entry for short-term calls
Based on current implied volatility (IV ≈ 17.8 %) & QQQ ≈ 605, the expected move (1σ range) for the coming week & into 24 October, where Expected Move = Price × IV × √(t/365)
So statistically, QQQ has about a 68% chance to stay between ≈ $585 & $625 by 24 October
If you’re bullish,
If you’re cautious/swing-trading,
If you prefer defined risk,
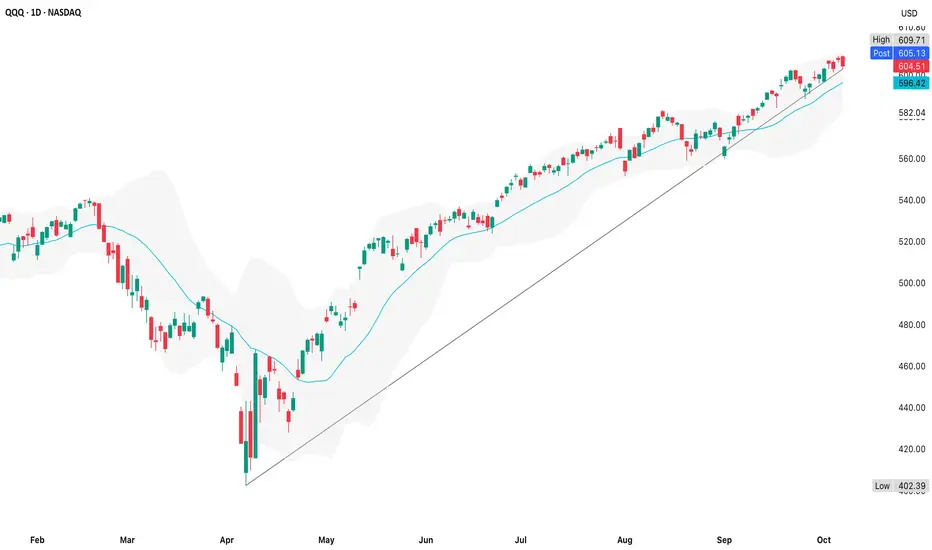
20d MA ≈ $597 lines up with the lower 1σ bound (~$590-$595)
1. Bounce from 20d MA $596–$600 with a retest of $610–$615 (60%)
2. Sideways continuation between $600–$610 (25%)
3. Close <$595 with a pullback to $580 (15 %)
A dip into $598-$600 with a stabilizing candle is statistically the highest-reward entry for short-term calls
- No reason to short unless price closes below both the trendline and 20d MA on elevated volume (>60M)
- If anything, the next real move could be a bounce attempt, not a flush
Based on current implied volatility (IV ≈ 17.8 %) & QQQ ≈ 605, the expected move (1σ range) for the coming week & into 24 October, where Expected Move = Price × IV × √(t/365)
- 17 October (10 days) ≈ 1σ 15 pts (68% probability) ≈ 2σ 30 pts (95% probability) $590-$620
- 24 October (17 days) ≈ 1σ 20 pts (68% probability) ≈ 2σ 40 pts (95% probability) $585-$625
- 31 October (24 days) ≈ 1σ 24 pts (68% probability) ≈ 2σ 48 pts (95% probability) $580-$630
So statistically, QQQ has about a 68% chance to stay between ≈ $585 & $625 by 24 October
If you’re bullish,
- Favor calls slightly OTM ($610-$615) expiry 24 October
- Target breakout confirmation above $608 with volume
If you’re cautious/swing-trading,
- Use short-dated, low-cost put lottos near $600 only on breakdown <$600 (ideally Friday/Monday flush)
If you prefer defined risk,
- Debit spreads ($605/$615 call spread) give good exposure without over-paying IV
20d MA ≈ $597 lines up with the lower 1σ bound (~$590-$595)
- Resistance near $612 is mid-upper 1σ band (~$620)
- So the option market’s “expected move” fits almost perfectly with your technical structure
I am not a licensed professional & these posts are for informational purposes only, not financial advice
Disclaimer
The information and publications are not meant to be, and do not constitute, financial, investment, trading, or other types of advice or recommendations supplied or endorsed by TradingView. Read more in the Terms of Use.