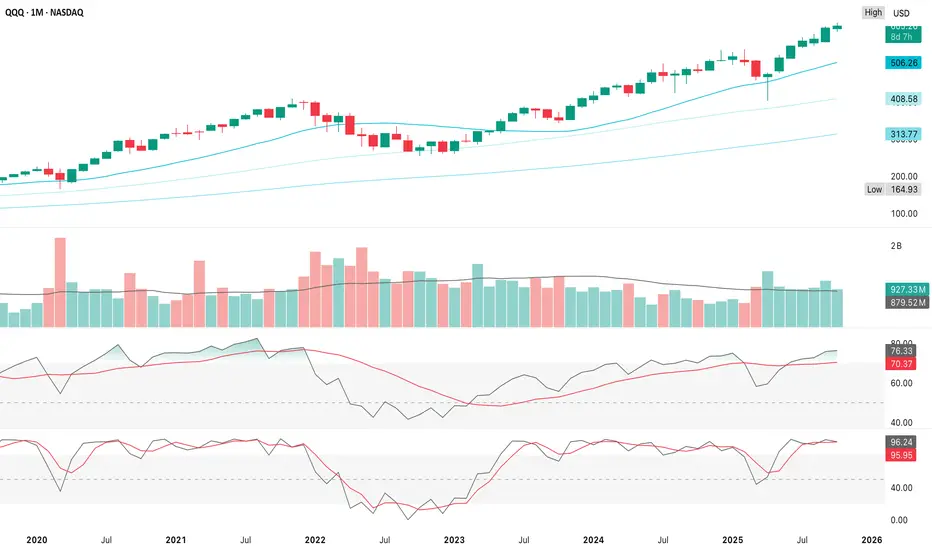
The monthly candles show a secular uptrend
The long-term “fuel” is still there, but risk-reward for new longer-term entries is thinning, so a multi-month consolidation or modest correction wouldn’t be unusual
Volume has drifted lower since 2022, which hints that participation has narrowed to the mega-caps
1. Continued grind higher
2. Healthy correction
3. Trend failure
The monthly chart shows QQQ in a mature but intact bull trend with momentum hot, volume thinning, room for a 5-10% reset without real technical damage
Feb-Mar 2020
Nov 2021-Jan 2022
Aug 2023-Oct 2023
Apr 2024-May 2024
-5% to -8% lasting 1-2 months while the long-term uptrend stays intact
1. RSI divergence on the weekly chart (lower high while price makes a higher high)
2. RSI falls back toward 60-65 on the monthly
🧭 Summary
Historical overbought phases in QQQ resolve with a –5% to –8% dip over 1-2 months,
usually bottoming around $560-$575, then resuming the larger bull trend
- Price remains well above the 20, 50 & 100 month moving averages
- Even with the short-term volatility we’ve seen around $603-$613, that’s just noise inside a steep upward channel
- Big-picture momentum is still firmly bullish
- Intraday price range are temporary mean-reversions inside an ongoing trend
The long-term “fuel” is still there, but risk-reward for new longer-term entries is thinning, so a multi-month consolidation or modest correction wouldn’t be unusual
- RSI ≈ 76 is solidly overbought, but not diverging yet - typical of strong late-cycle trends
- When RSI stays above 70 for months, it signals strength, not necessarily exhaustion
- Stochastic ≈ 96 is extremely stretched which is often where monthly pullbacks (5–10%) - it can stay pinned for months before reversing
Volume has drifted lower since 2022, which hints that participation has narrowed to the mega-caps
- That aligns with what we’re seeing day-to-day with QQQE (equal-weight) lagging, concentrated leadership from the largest names
1. Continued grind higher
- If earnings/CPI stay supportive, QQQ could extend toward $630-$640 before serious resistance - hold above $600
2. Healthy correction
- A 5-8% dip to $570-$580 would reset momentum without breaking trend
- Support at 20 month MA (~$505) if deeper
3. Trend failure
- Only a sustained break below $500-$505 would turn the monthly chart bearish
- 100 month MA near $314 = long-term floor
The monthly chart shows QQQ in a mature but intact bull trend with momentum hot, volume thinning, room for a 5-10% reset without real technical damage
- For day-to-day trading, expect more mean-reversion around $600-$620 until volatility events pass
- Long bias remains justified while price is above the 20 month MA
- Intraday fades & pullbacks are tactical only - they’re counter-trend, not trend reversals
- Watch IV + macro catalysts since spikes in implied volatility (earnings/CPI) often create those short-term pullbacks without changing the monthly structure
Feb-Mar 2020
- RSI > 75
- Stoch > 95
- –12 %
- 1 month COVID crash (black-swan, outsized)
Nov 2021-Jan 2022
- RSI ≈ 77
- Stoch ≈ 96
- –10 %
- 2 months
- Rate-hike scare, peak valuation
Aug 2023-Oct 2023
- RSI ≈ 74
- Stoch ≈ 94
- –7 %
- 2 months
- Bond-yield spike/earnings reset
Apr 2024-May 2024
- RSI ≈ 76
- Stoch ≈ 97
- –6 %
- 1 month
- Macro pause, then continuation
-5% to -8% lasting 1-2 months while the long-term uptrend stays intact
- Current price ≈ $604
- –5 % ≈ $573
- Minor swing-low support (Aug 2024 area)
- –7 % ≈ $562
- Volume-weighted support/10 month MA
- –10 % ≈ $543
- 2024 high retest, deeper but still trend-safe
- That $560-$575 area would relieve monthly overbought conditions without threatening the secular trend
1. RSI divergence on the weekly chart (lower high while price makes a higher high)
- Weekly close below $600 confirms cooling momentum
- VXN (Nasdaq Volatility Index) >20 shows volatility expansion accompanying the fade
- Volume expansion on red candles after CPI/Fed events
2. RSI falls back toward 60-65 on the monthly
- Price stabilizes near the 20 week or 50d MA (roughly $575-$585)
- IV compresses again in a new accumulation phase/continuation toward prior highs
🧭 Summary
Historical overbought phases in QQQ resolve with a –5% to –8% dip over 1-2 months,
usually bottoming around $560-$575, then resuming the larger bull trend
- Anything beyond –10 % would signal a regime change rather than a standard reset
I am not a licensed professional & these posts are for informational purposes only, not financial advice.
Disclaimer
The information and publications are not meant to be, and do not constitute, financial, investment, trading, or other types of advice or recommendations supplied or endorsed by TradingView. Read more in the Terms of Use.