Context
QQQ finished the week near the highs after a steady October climb. Buyers keep absorbing every shallow pullback. This week sits on two hinges. First, jobs and services data that nudge yields and implied vol. Second, a small cluster of tech earnings that can rotate leadership inside semis and handsets. The plan is simple. Let the market prove strength above the record band or let it pull back into patient demand. You will trade the reaction, not the forecast.
Chart setup
Use a one hour chart. Add 20 and 50 EMAs, a daily VWAP with bands, and the previous week high and low. Keep plots at global scope and turn lookahead off. Display VIX on a small separate pane for bias only.
Levels that matter
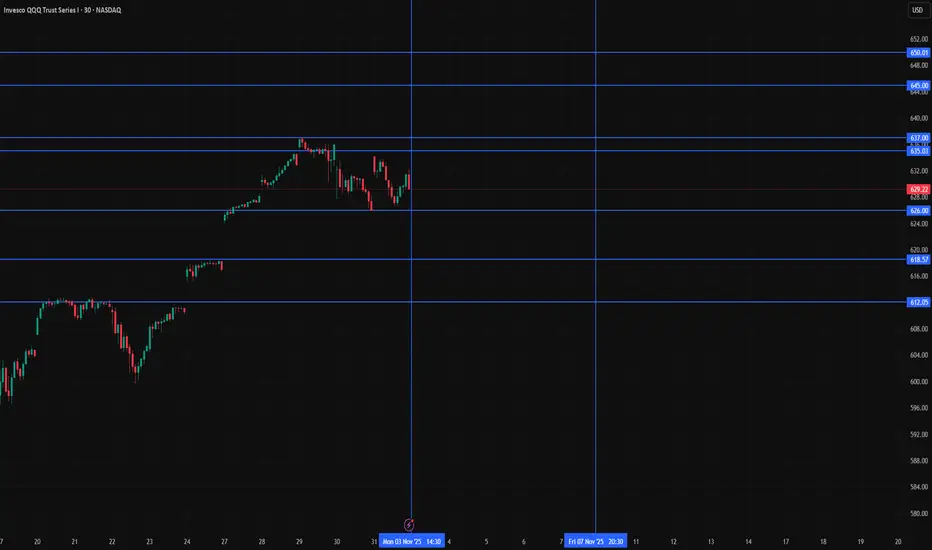
• 637.01 is the record high and the top of the current band
• 635 to 637 is the breakout ridge where wicks happen first and real holds happen later
• 629 is the Friday close reference for gap work on Monday
• 626 is last week’s first shelf where buyers defended cleanly
• 620 is a round shelf with memory from October
• 612 is the mean reversion area that often aligns with short term moving averages
• 597 is the bigger trend check where the intermediate crew steps in
How to read the week
Imagine a door at 637. When price opens that door and stays inside the new room for a while, trend traders have permission. If price knocks and gets rejected, range traders take the other side. If price steps down into 620 to 612 while volatility stays tame, that is where you seek bounces with tight risk. Your confirms are simple. VIX under the upper teens is friendly. Yields not jumping is friendly. If either flips, you slow down.
Three rules only
• Rule 1. Momentum only above the ridge. If cash breaks and holds above 637 for at least thirty minutes, take a starter. First target 645, stretch 650. Invalidate on a clean loss and thirty minute close back inside 635.
• Rule 2. Buy the dip into 620 to 612 only if volatility stays calm. Enter in the 620 to 612 pocket when VIX stays below your upper guardrail. Manage a first target 620 to 626 and trail. Invalidate on a decisive thirty minute close under 609 to 610.
• Rule 3. Risk first below 597. If the week forces a daily close below 597, treat it as a trend health check. Reduce gross and net and wait for a reclaim before trying to be a hero.
Why this works
One instrument. One band at the highs. One pocket for mean reversion. You are not predicting the data. You are pricing the reaction at the lines the market already respects. Breakout failures happen and that is fine because your hold filter removes most traps. Dips fail too and that is fine because your volatility guardrail removes the worst ones.
Intraday guide
• Morning plan. If we gap up into the ridge, let the first thrust exhaust and demand the hold. If we gap down toward 626, let the opening range print and only act after the first pullback.
• Midday plan. If price is inside 629 to 635 around lunch, expect chop. Trades there are optional.
• Afternoon plan. If the day is trending, trail behind a five minute reclaim of your entry line.
Risk and heat
Set maximum portfolio heat per idea at one half of one percent. Scale entries in thirds. Respect your stop even when it feels unfair. A string of small scratches is the tuition for the one clean runner that pays for the week.
Earnings and calendar awareness
AMD and Qualcomm after the close on Tuesday and Wednesday can swing semis and handsets. Shopify and Airbnb bookend consumer tone. The first week of the month carries ADP, services PMIs, ISM services, and payrolls. Do not guess the print. Trade the reaction at the levels on your chart. If VIX jumps before data, size down and wait for the dust to settle.
Cross checks
• If the ten year sits near recent levels or drifts lower, multiples breathe and the 637 break has better odds
• If VIX pins below the upper teens, dips are easier to buy
• If one of these flips, you slow down and treat the day like a range
Reminder
Education and analytics only. No advice. No guarantees. Process beats prediction.
QQQ finished the week near the highs after a steady October climb. Buyers keep absorbing every shallow pullback. This week sits on two hinges. First, jobs and services data that nudge yields and implied vol. Second, a small cluster of tech earnings that can rotate leadership inside semis and handsets. The plan is simple. Let the market prove strength above the record band or let it pull back into patient demand. You will trade the reaction, not the forecast.
Chart setup
Use a one hour chart. Add 20 and 50 EMAs, a daily VWAP with bands, and the previous week high and low. Keep plots at global scope and turn lookahead off. Display VIX on a small separate pane for bias only.
Levels that matter
• 637.01 is the record high and the top of the current band
• 635 to 637 is the breakout ridge where wicks happen first and real holds happen later
• 629 is the Friday close reference for gap work on Monday
• 626 is last week’s first shelf where buyers defended cleanly
• 620 is a round shelf with memory from October
• 612 is the mean reversion area that often aligns with short term moving averages
• 597 is the bigger trend check where the intermediate crew steps in
How to read the week
Imagine a door at 637. When price opens that door and stays inside the new room for a while, trend traders have permission. If price knocks and gets rejected, range traders take the other side. If price steps down into 620 to 612 while volatility stays tame, that is where you seek bounces with tight risk. Your confirms are simple. VIX under the upper teens is friendly. Yields not jumping is friendly. If either flips, you slow down.
Three rules only
• Rule 1. Momentum only above the ridge. If cash breaks and holds above 637 for at least thirty minutes, take a starter. First target 645, stretch 650. Invalidate on a clean loss and thirty minute close back inside 635.
• Rule 2. Buy the dip into 620 to 612 only if volatility stays calm. Enter in the 620 to 612 pocket when VIX stays below your upper guardrail. Manage a first target 620 to 626 and trail. Invalidate on a decisive thirty minute close under 609 to 610.
• Rule 3. Risk first below 597. If the week forces a daily close below 597, treat it as a trend health check. Reduce gross and net and wait for a reclaim before trying to be a hero.
Why this works
One instrument. One band at the highs. One pocket for mean reversion. You are not predicting the data. You are pricing the reaction at the lines the market already respects. Breakout failures happen and that is fine because your hold filter removes most traps. Dips fail too and that is fine because your volatility guardrail removes the worst ones.
Intraday guide
• Morning plan. If we gap up into the ridge, let the first thrust exhaust and demand the hold. If we gap down toward 626, let the opening range print and only act after the first pullback.
• Midday plan. If price is inside 629 to 635 around lunch, expect chop. Trades there are optional.
• Afternoon plan. If the day is trending, trail behind a five minute reclaim of your entry line.
Risk and heat
Set maximum portfolio heat per idea at one half of one percent. Scale entries in thirds. Respect your stop even when it feels unfair. A string of small scratches is the tuition for the one clean runner that pays for the week.
Earnings and calendar awareness
AMD and Qualcomm after the close on Tuesday and Wednesday can swing semis and handsets. Shopify and Airbnb bookend consumer tone. The first week of the month carries ADP, services PMIs, ISM services, and payrolls. Do not guess the print. Trade the reaction at the levels on your chart. If VIX jumps before data, size down and wait for the dust to settle.
Cross checks
• If the ten year sits near recent levels or drifts lower, multiples breathe and the 637 break has better odds
• If VIX pins below the upper teens, dips are easier to buy
• If one of these flips, you slow down and treat the day like a range
Reminder
Education and analytics only. No advice. No guarantees. Process beats prediction.
🔻Website: finaur.com/
🔻Strategies: finaur.com/lab/
🔻Blog: finaur.com/blog/
🔻Telegram : t.me/finaur_com/
🔻Trader Psychology Profile – thelumenism.com/
🔻Strategies: finaur.com/lab/
🔻Blog: finaur.com/blog/
🔻Telegram : t.me/finaur_com/
🔻Trader Psychology Profile – thelumenism.com/
Disclaimer
The information and publications are not meant to be, and do not constitute, financial, investment, trading, or other types of advice or recommendations supplied or endorsed by TradingView. Read more in the Terms of Use.