This ratio rises when QQQ strengthens & volatility (VIX) declines, a classic risk-on signal
QQQ/VIX this elevated often means traders are too comfortable
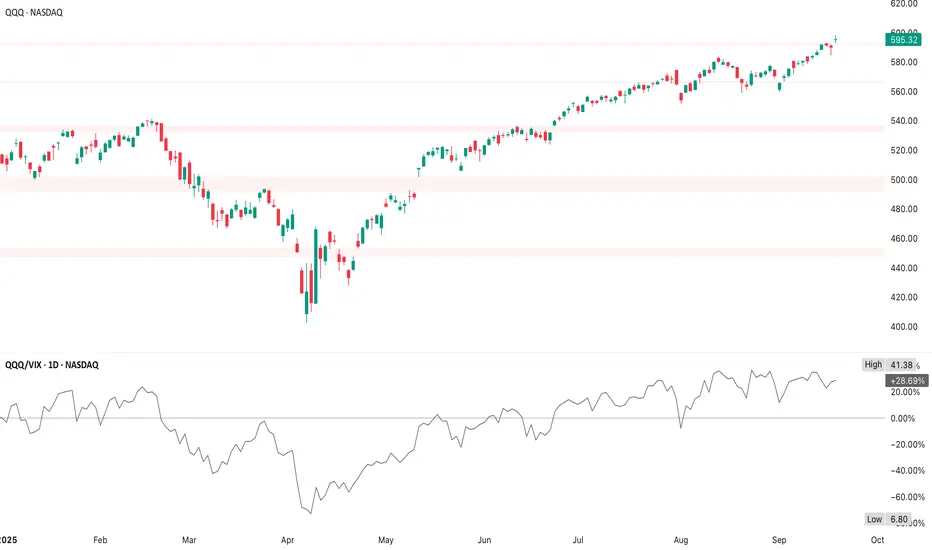
With QQQ at ~$600 & QQQ/VIX stretched, market may need a consolidation or correction before higher
1. Late January / Early February 2025
2. Mid-April 2025
3. Now (Mid-September 2025)
Every major QQQ pullback since late 2024 coincided with QQQ/VIX spiking near 35–40
QQQ/VIX is once again in the upper 30s
- The higher the ratio, the more “complacency” builds - extremes here often precede corrections
- Both QQQ & QQQ/VIX are at/near highs, which confirms bullish sentiment, but also shows that positioning is crowded
- If QQQ keeps pushing higher, but QQQ/VIX fails to confirm (flat or declining), that’s often an early warning of exhaustion
- Any sudden VIX spike (geo, macro, Fed) would drag this ratio down fast & pressure QQQ
QQQ/VIX this elevated often means traders are too comfortable
- Pullbacks tend to emerge from such levels
- If VIX jumps, ratio collapses
- Historically, that coincides with sharp QQQ corrections
With QQQ at ~$600 & QQQ/VIX stretched, market may need a consolidation or correction before higher
1. Late January / Early February 2025
- QQQ/VIX peaked near 41
- QQQ topped just above $580 before rolling into a multi-week correction
2. Mid-April 2025
- QQQ/VIX sharp rebound high (mid-30s)
- QQQ short-lived bounce before a deeper dip into May
3. Now (Mid-September 2025)
- QQQ/VIX at ~38, near prior extremes
- QQQ at $595, pressing resistance around $600
Every major QQQ pullback since late 2024 coincided with QQQ/VIX spiking near 35–40
- Peaks in the ratio tend to lead or align with local QQQ tops
- Once the ratio rolls over, QQQ usually corrects or at least consolidates
QQQ/VIX is once again in the upper 30s
- Unless the ratio makes a decisive breakout beyond prior extremes (sustaining >40), history suggests odds of a near-term pullback are elevated
- Watch closely for a stall or rollover in QQQ/VIX (early warning), a VIX spike (usually the trigger), or QQQ struggling with $600 resistance
I am not a licensed professional & these posts are for informational purposes only, not financial advice
Disclaimer
The information and publications are not meant to be, and do not constitute, financial, investment, trading, or other types of advice or recommendations supplied or endorsed by TradingView. Read more in the Terms of Use.