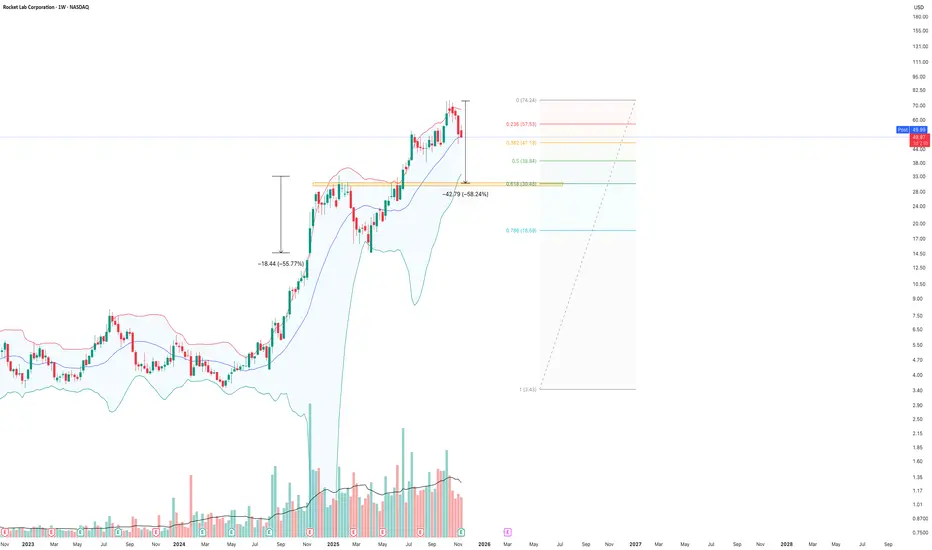
RKLB is completing a healthy corrective phase that mirrors its last major pullback. The current drop of ~58% is nearly identical to the previous ~56% correction, showing consistent trend behavior. Price is now heading toward the bottom of the weekly Bollinger Band, which aligns perfectly with the 0.618 Fibonacci retracement (~$31–33)—a historically reliable reaccumulation zone in RKLB’s uptrend.
This confluence suggests a high-probability bottom forming at the 0.618/Bollinger support before the long-term bullish trend resumes toward the $74+ extension targets.
Target ; $30.00 zone
Disclaimer
The information and publications are not meant to be, and do not constitute, financial, investment, trading, or other types of advice or recommendations supplied or endorsed by TradingView. Read more in the Terms of Use.
Disclaimer
The information and publications are not meant to be, and do not constitute, financial, investment, trading, or other types of advice or recommendations supplied or endorsed by TradingView. Read more in the Terms of Use.